Render Properties
The Render Properties tool controls how the active volume is rendered in the 3D view and how its gray values are displayed in the 2D slice views. It is organized in three pages:
| Page | Purpose |
|---|---|
| Render | Interactive histogram with the opacity, color, renderer, isosurface, and shading settings of the active volume |
| Masking | Restricts the 3D rendering to a region defined by mask objects or by ROI selection tools |
| Widgets | Slice planes, bounding boxes, axes, and clipping of the volume in the 3D view |
Accessing the Tool
- Navigate to the Image tab in the ribbon.
- Click Render Properties in the General section.
Alternatively, right-click the volume object in the Scene Tree and choose Render Properties....
An active volume dataset must be loaded in the project.
Brightness and contrast of the standard slice display are not set here. They are available in Window/Level in the View tab.
Opening the tool while the slice views are in the Standard slice display asks whether the slice display should be changed, so the colors set here are also seen in the slice views. See 2D Slice Views.
Render Page
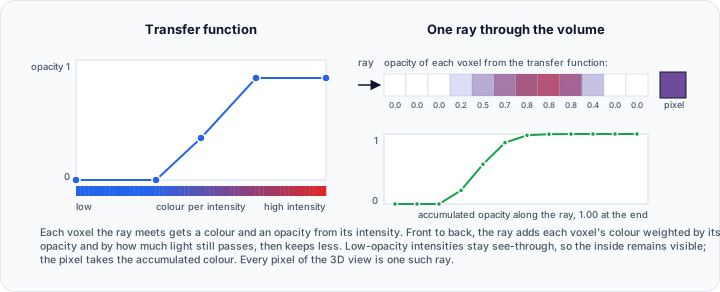
The Render page combines opacity and color transfer function editing, isosurface value adjustment, shading, and 2D contrast control in a single interactive histogram of the active volume. The gray value range can be divided into intervals, and each interval has its own opacity curve and color gradient. All changes are applied live to the 3D rendering and to the 2D slice views.
Presets
At the top of the page, a preset selection is available:
- The combo box lists the stored presets; selecting an entry applies its intervals, opacity curves, colors, interpolation, transparency, density, and shading to the current volume. Preset boundaries are stored relative to the gray value range, so a preset works for volumes with different ranges.
- The list shows one preset per row by name. The apply button re-applies the currently selected preset and renders a preview of every preset from the active volume; the previews are then shown next to the names until another volume is activated.
- The tool button menu offers saving the current settings as a new preset, updating the selected preset, exporting all presets to an XML file, importing presets from an XML file, removing the selected preset, and restoring the default presets.
Histogram Layout
The histogram view consists of the following elements, from top to bottom:
| Element | Description |
|---|---|
| Color bar | Horizontal bar at the top showing the color gradient of each interval, with round color handles. Interval dividers are marked by two stacked circles so they stay distinct from the single-circle color handles |
| Interval labels | Names of the intervals, drawn without a background over the top of the histogram. Click a label to rename the interval |
| Histogram area | Gray value histogram with the interval divider lines, the opacity curves, and the isosurface line. The interval colors fade from the color bar into the histogram area |
| Interval divider line | Blue vertical line separating two intervals, running from the color bar to the bottom of the histogram |
| Isosurface line | Red vertical line indicating the isosurface gray value (visible with the isosurface renderer) |
| Opacity curve | Blue polyline with round handles defining the opacity per interval. The selected line segment and handle are shown in red. A small gap between the plot top and full opacity keeps the topmost handles grabbable |
When the tool is opened, the opacity curve and the colors show the current opacity and color settings of the active volume, so the rendering does not change until the first edit. The histogram background is a gradient that is light at the top and dark at the bottom; it can be changed in the context menu under Background.
Mouse Interactions
Histogram Area
| Interaction | Effect |
|---|---|
| Click and hold the left mouse button on an empty area | Displays the minimum and maximum gray values of the volume and, if available, the current isosurface value |
| Drag an empty area while zoomed in | Pans the visible gray value range left and right |
| Hover an opacity handle | Shows the gray value and opacity of the handle |
| Click a blue line segment or opacity handle | Selects the segment and the opacity handle to its left; both turn red |
| Drag an opacity handle | Moves the handle. The gray value and opacity are shown while dragging |
| Drag a line segment up or down | Changes the opacity of both handles of the segment |
| Middle-click an empty position | Inserts an opacity handle at the exact position |
| Middle-click an opacity handle | Removes the handle and extends the selected line segment to the next handle to the left |
| Drag the red isosurface line | Changes the isosurface value and updates the 3D view. A tooltip shows the absolute isovalue |
Interval Divider Lines
| Interaction | Effect |
|---|---|
| Hover over a divider line | The mouse pointer changes to a horizontal resize arrow, and triangular handles appear to the left and right of the line |
| Drag the divider line | Moves the divider to a new position. The opacity curves and color gradients of both neighboring intervals rescale relative to their new ranges |
| Drag a triangular handle | Creates a new interval from the divider line to the position where the mouse button is released. Creating an interval automatically creates corresponding color handles |
Color Bar
| Interaction | Effect |
|---|---|
| Hover a color handle | Shows the gray value of the handle |
| Click a color handle | Selects the handle |
| Click a color segment | Selects the segment between two color handles |
| Drag a color handle | Moves the handle. The corresponding gray value is shown while dragging |
| Drag a color segment | Moves both handles of the segment. This is only possible if neither handle is bound to an interval boundary |
| Double-click a color handle | Opens the color dialog to assign a color to the gray value of the handle |
| Double-click a color segment | Opens the color dialog to assign a color to all gray values of the segment |
| Middle-click the color bar | Inserts a color handle at the exact position with the currently interpolated color |
| Middle-click a color handle | Removes the handle |
Edges and Zooming
The histogram always shows small white tick marks (major and minor) at the left, right, and bottom edges. Hovering over an edge highlights its ruler and shows the axis values next to the ticks.
| Interaction | Effect |
|---|---|
| Hover over the left edge | Highlights the frequency ruler (voxel counts) and shows a triangular handle for creating a new interval |
| Hover over the right edge | Highlights the opacity ruler (0 to 1) and shows a triangular handle for creating a new interval |
| Hover over the bottom edge | Highlights the gray value ruler |
| Mouse wheel over the left edge | Zooms the frequency axis of the histogram |
| Mouse wheel over the right edge | Zooms the opacity curve |
| Mouse wheel in the histogram area | Zooms the gray value axis around the mouse position |
| Drag an empty area while zoomed in | Pans the visible gray value range |
Use Reset Zoom in the context menu to fit the entire histogram to the window again.
Buttons
Below the histogram, the following buttons are available:
| Button | Description |
|---|---|
| Add opacity handle | Adds a new opacity handle at the center of the selected curve segment. The new handle and the line segment to its right are selected |
| Remove opacity handle | Deletes the selected opacity handle and extends the selected line segment to the next handle to the left |
| Add color handle | Adds a new color handle at the center of the selected color segment, initialized with the color at that gray value |
| Remove color handle | Deletes the selected color handle |
| Logarithmic/linear scaling | Toggles between logarithmic and linear scaling of the frequency axis |
| Isosurface value adjustment | Turns the adjustable isosurface value on or off (isosurface renderer only). When off, a fixed default isovalue at the middle of the gray value range is shown and used for the 3D rendering; the previous user value is restored when turned on again |
Options
| Control | Description |
|---|---|
| Renderer | Rendering algorithm for the 3D view: Isosurface Renderer, Volume Renderer, Maximum Projection, Minimum Projection, Average Projection, or Additive Projection |
| Interpolation | Sampling of the volume image in the 3D view: nearest neighbor or linear |
| Isosurface | Gray value of the isosurface. Can also be adjusted by dragging the red isosurface line (isosurface renderer only). A reconstructed volume starts at the level halfway between its background and material gray values, so the surface is visible without hunting for it |
| Transparency | Transparency of the isosurface (0 = opaque, 100 = fully transparent). Shown for the isosurface renderer only |
| Density | Factor for the opacity values of the opacity curve in the 3D view (0 = fully transparent, 1 = opacity curve values, 10 = 10 times the opacity curve values). Shown for the other renderers only |
The Isosurface Renderer and Average Projection entries are only selectable while the volume uses GPU rendering. On a volume rendered on the CPU they are disabled, and the Volume Renderer is used instead.
Surface Shading
The Surface Shading group at the bottom of the page controls how lighting affects the active volume in the 3D view. The group is collapsed by default; click its title to expand it. If the task panel is shorter than the page, scroll down to reach it.
| Control | Description |
|---|---|
| Shade | Turns shading of the active volume on or off |
| Type | Selects an Ambient, Dull, Smooth, Shiny, or Bright material. A manual combination that does not match a named type is shown as Custom |
| Ambient | Sets the intensity of uniform background lighting from 0 to 100 |
| Diffuse | Sets the intensity of lighting scattered by the surface from 0 to 100 |
| Specular | Sets the intensity of reflected highlights from 0 to 100 |
| Shininess | Sets the sharpness of reflected highlights from 1 to 128 |
Context Menu
Right-clicking the histogram area or the color bar opens a context menu. The opacity commands are only offered in the histogram area, not in the color bar.
| Item | Description |
|---|---|
| Split Interval Here | Creates a new interval divider line at the position of the mouse pointer |
| Merge Interval | Merges the interval with its left or right neighbor. Existing color segments are kept, so the color assignment remains unchanged. The merged interval keeps the name of the left of the two intervals, and stays visible if either of them was visible |
| Remove Interval | Removes the interval and its color segments, and grows the left or right neighbor over the freed range |
| Disable/Enable Interval | Hides or shows the gray values of the interval in the 2D and 3D views |
| Insert Color Handle | Inserts a color handle at the position of the mouse pointer |
| Delete Color Handle | Removes the selected color handle |
| Handle Color | Assigns a predefined or custom color to the selected color handle |
| Segment Color | Assigns a color to the selected color segment. The color overrides the colors of the start and end handles of the segment |
| Interval Color | Assigns a constant color to the whole interval. All color handles inside the interval are removed |
| Copy Interval Colors | Copies the color handles of the interval under the mouse pointer |
| Paste Interval Colors | Pastes the copied color handles to the interval under the mouse pointer |
| Save Interval Colors... | Saves the colors of the interval to a .lut or .act file |
| Load Interval Colors... | Loads colors from a .lut or .act file and applies them to the interval |
| Insert Opacity Handle | Inserts a handle in the middle of the selected line segment |
| Delete Opacity Handle | Removes the selected handle |
| Copy Opacity Curve | Copies the opacity curve of the interval under the mouse pointer |
| Paste Opacity Curve | Pastes the copied opacity curve to the interval under the mouse pointer |
| Opacity Curve | Sets the curve to linear (default), all opaque, or all transparent |
| Background | Changes the histogram background (default gradient, window color, white, dark, or black) |
| Reset Zoom | Fits the entire chart to the current window size |
| Hide/Show Histogram Curve | Toggles the visibility of the gray value histogram |
| Export Data (CSV)... | Exports the gray value distribution of the active volume to a CSV file |
| Copy to Clipboard | Copies a screenshot of the chart to the system clipboard |
The exported file is written at the full resolution of the volume, not at the resolution the curve is drawn with. Both count the same voxels, a gray value of zero included. For an integer image the file resolves every gray value, so each row carries one gray value and its voxel count. A floating point image has no gray value step, so each row covers a range of gray values and states it in a Gray value from and a Gray value to column, followed by the voxel count.
How Changes Affect the Views
3D View
- With the Isosurface Renderer, the surface at the isovalue uses the Transparency setting; dragging the red isosurface line updates the surface immediately. The opacity curve does not change the isosurface transparency, but a disabled interval is excluded from the surface.
- With all other renderers, the opacity curves of all intervals form the opacity transfer function of the volume rendering, scaled by the Density factor.
- The color handles of all intervals form the color transfer function.
- Disabled intervals are rendered fully transparent.
- The Surface Shading settings control the lighting and reflected highlights of the active volume.
2D Slice Views
The slice views offer three display modes, selected from Slice Display in the View ribbon tab, in the visibility menu of a 2D view controller, or in the right-click menu of a slice view:
| Mode | Description |
|---|---|
| Standard | Shows the slices with the brightness, contrast, and color of the volume itself. The window and level settings are available |
| Gray Value Intervals | Shows the slices with the colors assigned to the intervals, at full strength |
| Gray Value Intervals with Opacity | Shows the interval colors weighted by their opacity curves, so the curves define the contrast |
Both interval modes define the displayed colors completely, in the slice views and in the slice planes of the 3D view alike, so the window and level settings are turned off while one of them is active.
Opening the tool while the slice views are in Standard asks whether Slice Display should be changed to Gray Value Intervals with Opacity. Answer Yes to see the intervals in the slice views right away, or No to keep the standard display and edit for the 3D view alone. The question carries a Do not show this message again check box, and it is skipped for a volume that has no interval colors yet.
- With Gray Value Intervals with Opacity the opacity curve acts as a contrast adjustment relative to each interval range, not as a global contrast change. For example, an opacity handle at full opacity placed at a low gray value brightens that range like a narrow window setting.
- Moving an interval divider rescales the mapping of both neighboring intervals.
- Disabled intervals are displayed black in both interval modes.
- The color map bar of the slice views always shows the colors that are currently displayed.
Opening the tool does not change the current 3D rendering. The renderer, interpolation, isosurface value, opacity curve, colors, and shading are read from the active volume, so the page starts with the settings the volume is rendered with.
The window and level of the volume are never changed here. Switching a slice view back to Standard therefore restores exactly the display that was in effect before.
Closing the tool leaves the slice views in the mode they are in, so the interval colors stay visible. Switch to Standard from the Slice Display menu to bring the window and level display back.
The display mode, intervals, colors, opacity curves, density, transparency, and shading are stored with the volume and are saved in the project. Switching between volumes, closing and reopening the tool, or reopening it after another tool changed the volume rendering therefore shows the settings of the active volume again. A volume that has not been edited here yet starts with Gray Value Intervals with Opacity. If another tool replaced the opacity curve or the colors in the meantime, the intervals are rebuilt from that new state. An operation that changes the image data of a volume keeps its intervals and its display mode; image data with an unrelated gray value range resets them.
Each volume is shown in the display mode it was last set to. Activating another volume and reopening the project restore that mode, and every Slice Display menu follows it. The two interval modes need the colors defined here, so a volume that has none yet falls back to Standard; open it on this page once to define them.
Typical Workflow
- Open the tool with a volume loaded. The histogram shows the current opacity curve and colors of the volume in a single interval.
- Optionally select a stored preset from the combo box at the top.
- Create an interval for each material: hover over a plot edge or a divider line and drag a triangular handle, or use Split Interval Here in the context menu.
- Shape the opacity curve of each interval: middle-click to add handles, drag handles or line segments, or use the buttons below the histogram.
- Assign colors: double-click color handles or segments, or use the context menu color commands.
- For industrial CT style surface visualization, select the Isosurface Renderer and drag the red isosurface line until the surface matches the material boundary.
This isosurface value controls what the 3D view draws. It is not a measurement, and it is independent of the isovalue of the Surface Determination tool: moving it to look at something never changes a surface that has been determined, and determining a surface never changes the view you set up. Both start from the same estimate of the volume, so they agree until one of them is deliberately moved. 7. For volume rendering, fine-tune the 3D transparency with the Density factor. 8. Expand Surface Shading to refine the lighting and surface highlights in the 3D view. 9. Save the result as a preset for reuse on other volumes.
Tips
- Renaming intervals (click the interval label) helps keep track of materials such as "Air", "Plastic", or "Metal".
- Use Disable Interval to temporarily hide a gray value range, for example to hide the mounting fixture of a scanned part.
- The logarithmic frequency scale (default) makes small histogram peaks visible; switch to linear scaling to compare peak heights.
- Zoom into the gray value axis with the mouse wheel and drag the zoomed histogram to position handles precisely on narrow histogram peaks.
Masking Page
The Masking page limits the 3D rendering of the volume to a selected region. Choose the method in the Masking method combo box:
| Method | Description |
|---|---|
| Use mask objects | Uses the mask object(s) of the project to mask the 3D rendering of the active volume object |
| Use ROI selection tools | Uses ROI selection tools to mask the 3D rendering of the visible volume object(s) |
The controls of the selected method are shown below the combo box. The ROI selection tools are switched off whenever the page is changed.
Widgets Page
The Widgets page carries the slice planes, bounds, and clipping options of the active volume in the 3D view.
Slice Planes in the 3D View
Enable Show slice planes, then pick the plane to configure in the combo box above the plane settings. The three entries are Plane 1 (YZ), Plane 2 (XZ), and Plane 3 (XY); each plane keeps its own settings.
| Setting | Description |
|---|---|
| Opacity | Opacity of the slice image on the plane. Enable depth peeling in the 3D view settings when the planes are semi-transparent |
| Reslice interpolate | Sampling of the volume for the slice image: Nearest, Linear, or Cubic |
| Texture interpolate | Smoothing of the slice image on the plane |
| Outline visibility | Shows or hides the colored border of the plane |
| Use as clip plane | Cuts the objects of the 3D view open along this plane: Off, Keep front, or Keep back |
Use as clip plane
With Use as clip plane set to Keep front or Keep back, the plane hides everything on one side of it, so the scene is drawn as if it had been cut along the current slice. This is the quickest way to see the interior of an object at the position you are looking at in the 2D view.
- The two entries select which half stays. Which half each one keeps depends on the orientation of the image data, so if the wrong half disappears, pick the other entry
- The cut follows the slice as it moves
- It applies to every visible object with clipping enabled, not only to this volume
- Each of the three planes carries its own setting; two parallel planes set to keep the space between them leave a slab
- Hiding the plane stops the cut. To keep the cut without seeing the plane, set its Opacity to 0 and Outline visibility to Off instead
- Up to six planes cut at a time, or two while the 3D clipping box is enabled. If the limit is reached, extra clip-plane settings are turned off
- The 3D clipping box cannot be inverted while a plane cuts
- The 3D clipping box also cannot be inverted while a visible volume with clipping enabled uses CPU rendering
The setting is saved with the project and is restored, together with the plane visibility it needs, when the project is reopened.
See Slice Plane Clipping for details.
Bounds
| Option | Description |
|---|---|
| Corner bounding box | Shows the corner markers of the volume bounds |
| Scale axes | Shows the scaled bounding box with tick marks |
| Axes labels | Shows the side labels of the bounding box |
| Outline bounding box | Shows the full outline of the volume bounds |
| Origin Axes | Shows the 3D axes at the origin of the image |
The button next to each of the first four options opens a color dialog for that element.
Other Options
| Option | Description |
|---|---|
| Clipping | Allows this volume to be cut open in the 3D view. When it is off, neither the 3D clipping box nor a slice plane used as a clip plane affects it |
Every object carries its own Clipping setting, so a volume can stay whole while the surfaces and meshes around it are cut open. The setting has no effect while nothing in the scene is set to clip.
Render properties are saved with the project file and restored when the project is reopened.