Volume Grayscale Image
A volume grayscale image is the primary data type in Volvicon. It represents three-dimensional image data where each point in space has a grayscale intensity value.
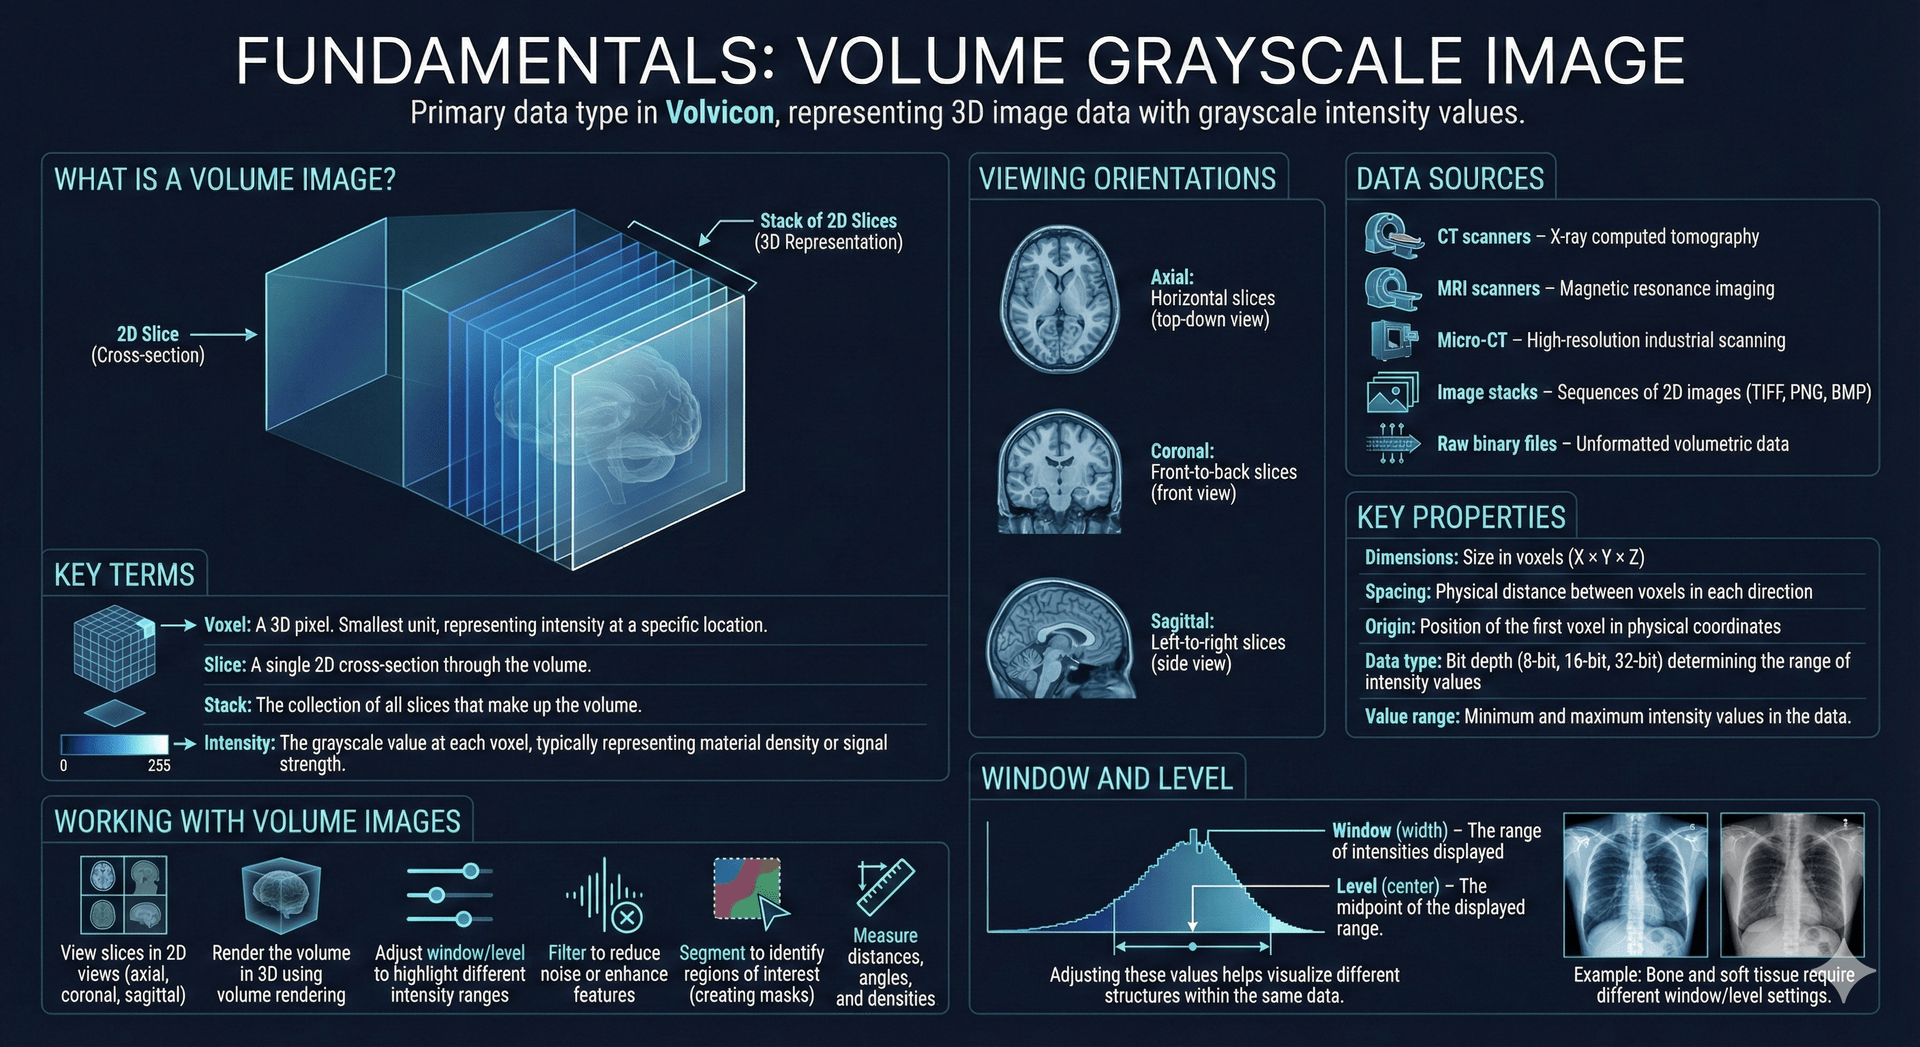
What is a Volume Image?
Think of a volume image as a stack of 2D images (slices) arranged in 3D space. Each slice shows a cross-section of the scanned object, and together they form a complete 3D representation.
| Term | Description |
|---|---|
| Voxel | A 3D pixel. The smallest unit of a volume image, representing intensity at a specific location |
| Slice | A single 2D cross-section through the volume |
| Stack | The collection of all slices that make up the volume |
| Intensity | The grayscale value at each voxel, typically representing material density or signal strength |
Viewing Orientations
Volume images can be viewed from three standard orientations:
| Orientation | Description |
|---|---|
| Axial | Horizontal slices (top-down view) |
| Coronal | Front-to-back slices (front view) |
| Sagittal | Left-to-right slices (side view) |
Data Sources
Volume images in Volvicon can come from various sources:
- CT scanners – X-ray computed tomography
- MRI scanners – Magnetic resonance imaging
- Micro-CT – High-resolution industrial scanning
- Image stacks – Sequences of 2D images (TIFF, PNG, BMP)
- Raw binary files – Unformatted volumetric data
Key Properties
Every volume image has these properties:
| Property | Description |
|---|---|
| Dimensions | Size in voxels (X × Y × Z) |
| Spacing | Physical distance between voxels in each direction |
| Origin | Position of the first voxel in physical coordinates |
| Data type | Bit depth (8-bit, 16-bit, 32-bit) determining the range of intensity values |
| Value range | Minimum and maximum intensity values in the data |
Working with Volume Images
In Volvicon, you can:
- View slices in 2D views (axial, coronal, sagittal)
- Render the volume in 3D using volume rendering
- Adjust window/level to highlight different intensity ranges
- Filter to reduce noise or enhance features
- Segment to identify regions of interest (creating masks)
- Measure distances, angles, and densities
Window and Level
Window and level (also called window width and window center) control how intensity values are mapped to display brightness:
- Window (width) – The range of intensities displayed
- Level (center) – The midpoint of the displayed range
Adjusting these values helps visualize different structures within the same data. For example, bone and soft tissue require different window/level settings.
Related Topics
- Masks – Segmenting regions within volume images
- Rendering Types – Visualizing volume data in 3D