PDF Report Generation
The PDF Report dialog provides an interface for generating PDF reports. This feature is available from various tools in the application when exporting statistics, measurements, or analysis results.
Accessing PDF Report Generation
The PDF Report dialog appears when you click Export... in tools such as:
- Measurements
- Volume Statistics
- Mask Statistics
- Surface Statistics
- Volume Mesh Statistics
- Mesh Quality Analyzer
- Slice Analyzer
Dialog Structure
The PDF Report dialog is organized into four tabs, each providing specific functionality for report customization.
3D Scene Tab
The 3D Scene tab allows you to select which 3D objects to include as an interactive 3D view embedded in the PDF.
Volvicon has been tested with Adobe Acrobat handling models up to 4 million mesh elements in internal validation. 3D PDF performance may vary by PDF viewer, graphics configuration, and hardware.
Some PDF viewers may struggle with large embedded 3D content (typically above 666666 mesh elements), which can result in slow rendering or an empty 3D page. If you encounter performance issues:
Troubleshooting options:
- Try a 3D-capable PDF viewer (for example, Adobe Acrobat)
- In Acrobat, open Menu → Preferences → Multimedia & 3D → Renderer Options → Preferred Renderer and test available renderer options (for example, DirectX on Windows or OpenGL where available)
- If Acrobat 3D rendering remains unstable on Windows, Adobe documents using DirectX 9 for 3D rendering in Acrobat/Reader
- Optional installer (Windows): Microsoft DirectX End-User Runtime Web Installer
- Reduce mesh complexity using decimation tools before exporting
- Split large models into multiple PDF pages or separate files
Performance Tips:
- Close other applications to free up system resources
- Update your graphics drivers to the latest version
- Ensure your PDF viewer supports hardware-accelerated 3D rendering
- Validate viewer/renderer changes against your organization IT and security policies before rollout
Description
Select which 3D scene objects to include in the PDF report. The selected objects will be exported as an interactive 3D view.
Object Selection
| Checkbox | Description |
|---|---|
| Visible masks | Include the preview surface of the visible mask objects in the 3D scene |
| Visible surfaces | Include all visible surface objects as surface meshes in the 3D scene |
| Visible volume meshes | Include the surface mesh of each visible volume mesh object in the 3D scene |
| Visible primitives | Include the surface mesh of each visible primitive object in the 3D scene |
| Visible measurements | Include visible measurements (point, distance, and text annotation) in the 3D scene |
Only point, distance, and text annotation measurement types are supported for 3D PDF embedding. Other measurement types (angle, contour, circle, etc.) will be ignored.
Toolbar
| Button | Description |
|---|---|
| Select All | Select all object types |
| Deselect All | Deselect all object types |
3D PDF Support
3D PDF embedding requires a Standard or higher license. Demo and Trial licenses cannot generate interactive 3D content in PDF reports.
The 3D viewer in the PDF allows:
- Interactive rotation, zoom, and pan
- View navigation using standard PDF reader controls
- Preserves camera position from the application
Snapshots Tab
The Snapshots tab allows you to capture and manage screenshots for inclusion in the report.
Capture Targets
Select a target from the dropdown and click the capture button:
| Target | Description |
|---|---|
| Application | Capture the entire application window |
| Scene | Capture the current viewport layout |
| 3D view | Capture the 3D rendering view |
| 2D right view (YZ plane) | Capture the right/sagittal slice view |
| 2D front view (XZ plane) | Capture the front/coronal slice view |
| 2D top view (XY plane) | Capture the top/axial slice view |
Snapshot Grid
Captured snapshots are displayed in a grid with 6 columns and thumbnails sized at 128×80 pixels.
Snapshot Management
| Control | Description |
|---|---|
| Capture | Capture the selected view target |
| Delete | Remove the selected snapshot(s) |
| Delete All | Remove all captured snapshots |
| Select All | Select all snapshots |
| Deselect All | Deselect all snapshots |
Features
- Checkbox selection: Each snapshot has a checkbox to include/exclude from report
- Drag and drop: Reorder snapshots by dragging
- Preview: Double-click a snapshot to preview at full resolution
- Persistence: Snapshots are saved and restored between sessions
Measurements Tab
The Measurements tab allows you to include measurement data tables in the report.
Toolbar
| Button | Description |
|---|---|
| Select Measurements... | Open dialog to choose which measurements to include |
| Clear Measurements | Remove all measurements from the report |
Measurement Display
Measurements are organized by type in collapsible group boxes:
- Point measurements
- Distance measurements
- Angle measurements
- Diameter measurements
- Contour measurements
- Circle measurements
- Ellipse measurements
- Rectangle measurements
- Box measurements
- Caption annotations
Table Columns
Each measurement type displays appropriate columns:
- Measurement name/label
- Coordinates or dimensions
- Measured values
- Units
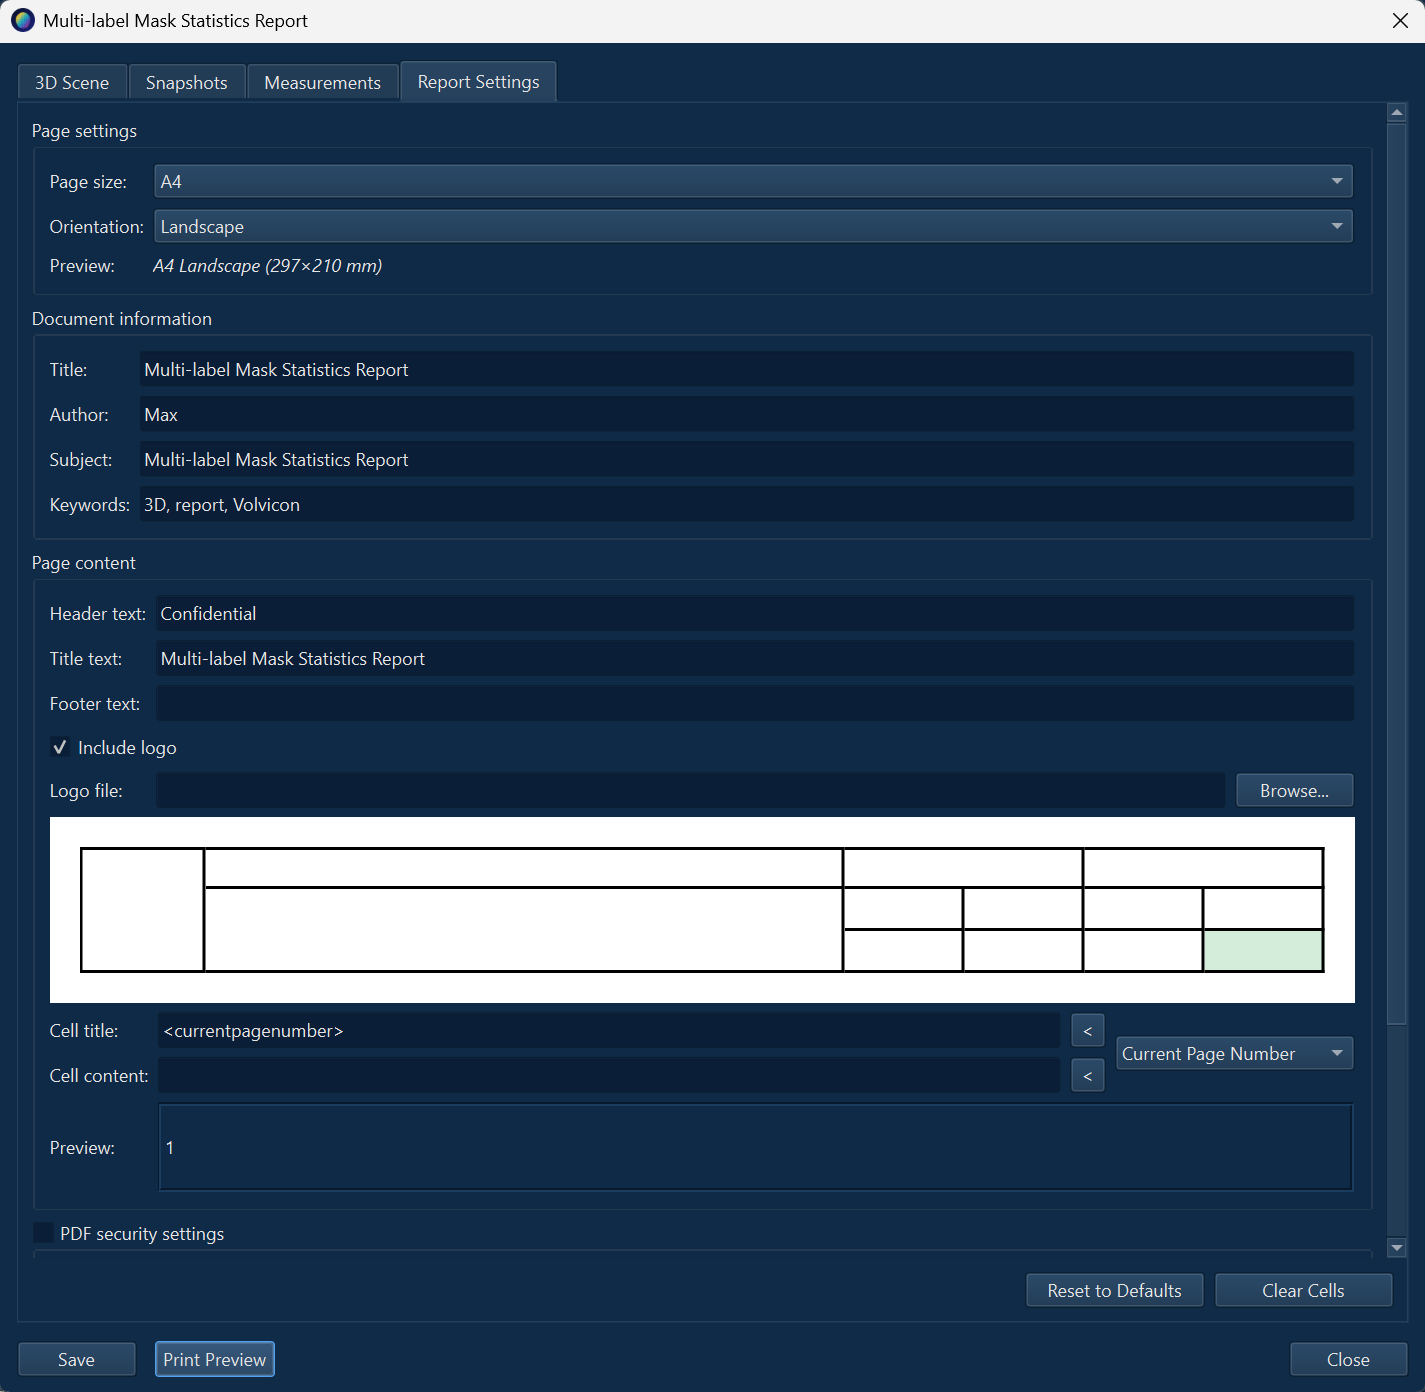
Report Settings Tab
The Report Settings tab provides options for configuring the PDF output.
Page Settings
| Option | Description |
|---|---|
| Page size | A3, A4 (default), A5, or Letter |
| Orientation | Portrait or Landscape (default) |
| Preview | Shows dimensions (e.g., "A4 Landscape (297×210 mm)") |
Document Information
| Field | Description |
|---|---|
| Title | Document title for PDF metadata |
| Author | Document author name |
| Subject | Document subject/description |
| Keywords | Searchable keywords (comma-separated) |
Page Content
| Option | Description |
|---|---|
| Header text | Text displayed at the top of each page |
| Title text | Main report title |
| Footer text | Text displayed at the bottom of each page |
| Include logo | Enable logo image in header |
| Logo file | Path to custom logo image (PNG, JPEG) |
Report Grid Layout
The report includes a customizable grid table on the title page with 13 editable cells:
| Cell | Position | Description |
|---|---|---|
| Logo Cell | Column 0, spans 3 rows | Company or project logo |
| Col1 Top | Column 1, Row 0 | Primary title |
| Col1 Bottom | Column 1, Rows 1-2 | Description text |
| Col2 Top | Column 2, Row 0 | Section header |
| Col2 Middle Left/Right | Column 2, Row 1 | Key-value pairs |
| Col2 Bottom Left/Right | Column 2, Row 2 | Additional information |
| Col3 Top | Column 3, Row 0 | Section header |
| Col3 Middle Left/Right | Column 3, Row 1 | Key-value pairs |
| Col3 Bottom Left/Right | Column 3, Row 2 | Additional information |
Cell Editor
Click on any cell in the grid to edit its content:
| Field | Description |
|---|---|
| Cell title | Heading text for the cell |
| Cell content | Detailed content text |
| Template variable | Dropdown to insert dynamic content |
| Insert (< button) | Insert selected template into title or content |
| Preview | Shows resolved template values |
Template Variables
| Variable | Description |
|---|---|
<currentdate> | Current date (yyyy-MM-dd) |
<currenttime> | Current time (hh:mm:ss) |
<currentdatetime> | Date and time combined |
<currentpagenumber> | Page number in report |
<nameshort> | Short analysis name |
<namelong> | Full analysis name with object |
<namelongwithfilename> | Analysis name with project file |
<type> | Analysis type |
Security Settings
Enable the PDF security settings checkbox to access:
| Option | Description |
|---|---|
| User password | Password required to open the document |
| Owner password | Password for security settings (required) |
| Allow printing | Permit document printing |
| Allow copying | Permit text/image copying |
| Allow editing | Permit document modification |
- User and owner passwords must be different when security is enabled
- Owner password cannot be empty
- Store passwords securely - lost passwords cannot be recovered
Toolbar
| Button | Description |
|---|---|
| Reset to Defaults | Reset all settings to default values |
| Clear Cells | Clear content of all grid cells |
Dialog Buttons
| Button | Description |
|---|---|
| Save | Generate and save the PDF report |
| Print Preview | Generate a temporary preview |
| Close | Close the dialog without saving |
License Limitations
Feature availability depends on your license level:
| License | Max Pages | 3D PDF | Watermark |
|---|---|---|---|
| Demo/Trial | 10 | No | "DEMO VERSION" or "TRIAL VERSION" |
| Student | 25 | Yes | "EDUCATIONAL USE ONLY" |
| Standard | 50 | Yes | No |
| Professional/Ultimate | Unlimited | Yes | No |
| Research | Unlimited | Yes | No |
Workflow
Complete Report Generation
- Open a tool with data to export (e.g., Mask Statistics)
- Click Export... to open the PDF Report dialog
- 3D Scene tab: Select objects for interactive 3D view
- Snapshots tab: Capture relevant views
- Measurements tab: Select measurements to include
- Report Settings tab: Configure page, content, and security
- Click Print Preview to review
- Click Save to generate the final PDF
Quick Report
- Click Export... from any statistics tool
- Go to Report Settings tab
- Accept default settings or make minimal changes
- Click Save and choose output location
Tips
- Use high-resolution snapshots for better print quality
- Include relevant statistics tables in the report
- Use template variables for consistent, dynamic content
- Set appropriate security for sensitive reports
- Preview before saving to verify layout
- The grid table appears on the title page only
- Snapshots are added as separate pages after statistics
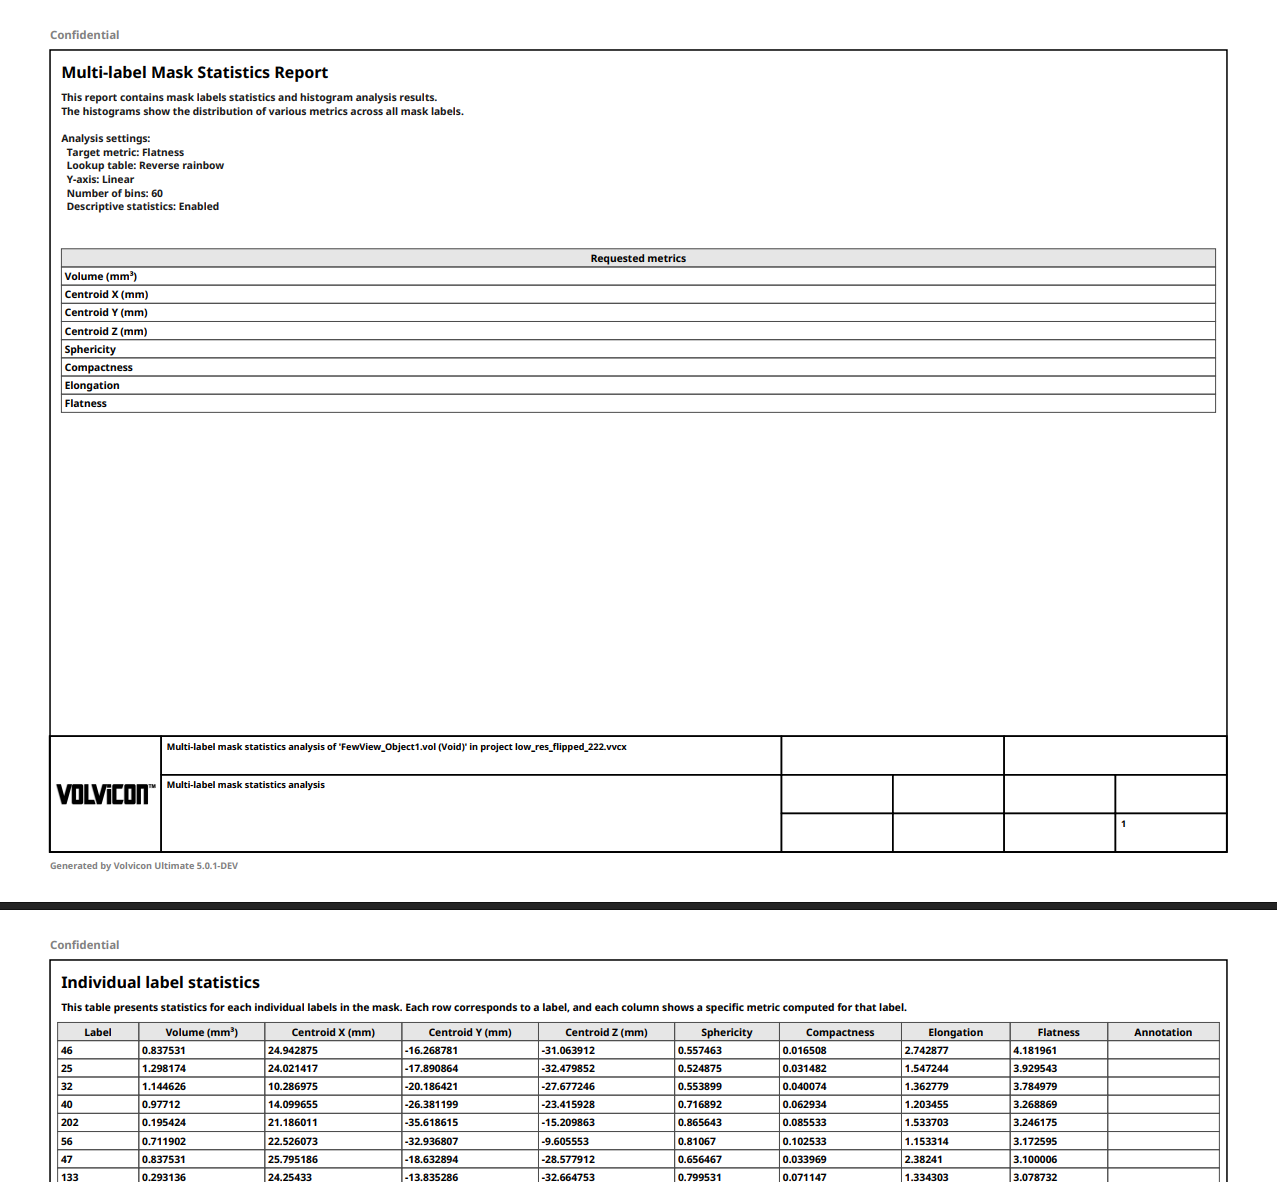
Sample PDF Report
Trademark Notice
Adobe, Acrobat, and Reader are trademarks or registered trademarks of Adobe in the United States and/or other countries.