The Mesh Quality Analyzer provides tools for analyzing the quality of mesh elements. Available through a dropdown menu, it offers separate analyzers for surface meshes (triangle quality) and volume meshes (element quality).
Navigate to the Measure tab in the ribbon
Click the Mesh Quality Analyzer dropdown button in the Analysis section
Select Surface Mesh Quality or Volume Mesh Quality
Surface Mesh Quality
Analyze the active surface mesh for triangle quality. The tool calculates selected quality metrics for all triangles, displays their statistical distribution, and provides controls to filter and highlight triangles based on metric thresholds in the 3D view.
Options
Control Description Select statistics Choose the quality metrics to analyze Target metric Select the metric for visualization and analysis Lookup table Select the color map for visualizing quality in 3D
Histogram
Control Description Y-axis Frequency or Percentage scale Number of bins Histogram bin count (10–1000, default: 50)
Quality Metrics
Available quality metrics for triangles include:
Metric Description Ideal Range Area Triangle surface area Depends on application Aspect Ratio Ratio of longest to shortest edge Close to 1 Condition Condition number of the element Close to 1 Distortion Measure of element deformation Close to 1 Edge Ratio Ratio of maximum to minimum edge length Close to 1 Max Angle Maximum interior angle < 90° Min Angle Minimum interior angle > 30° Relative Size Squared Size relative to average Close to 1 Scaled Jacobian Jacobian scaled to [-1, 1] Close to 1 Shape Shape quality measure Close to 1 Shape and Size Combined shape and size quality Close to 1
Quality Metrics Interpretation
For finite element analysis:
Triangle angles should be between 30° and 90° for optimal accuracy
Aspect ratios close to 1 indicate well-shaped elements
Use the histogram to identify outliers that may affect simulation quality
Annotation
Option Description Pick element on mesh Click on mesh to highlight element and display metric value Copy to Measurements Copy visible annotation to Measurements panel
Note : Hold the Alt key to enable view spinning while picking elements.
Field Description Total occurrences Number of elements outside the min/max range values
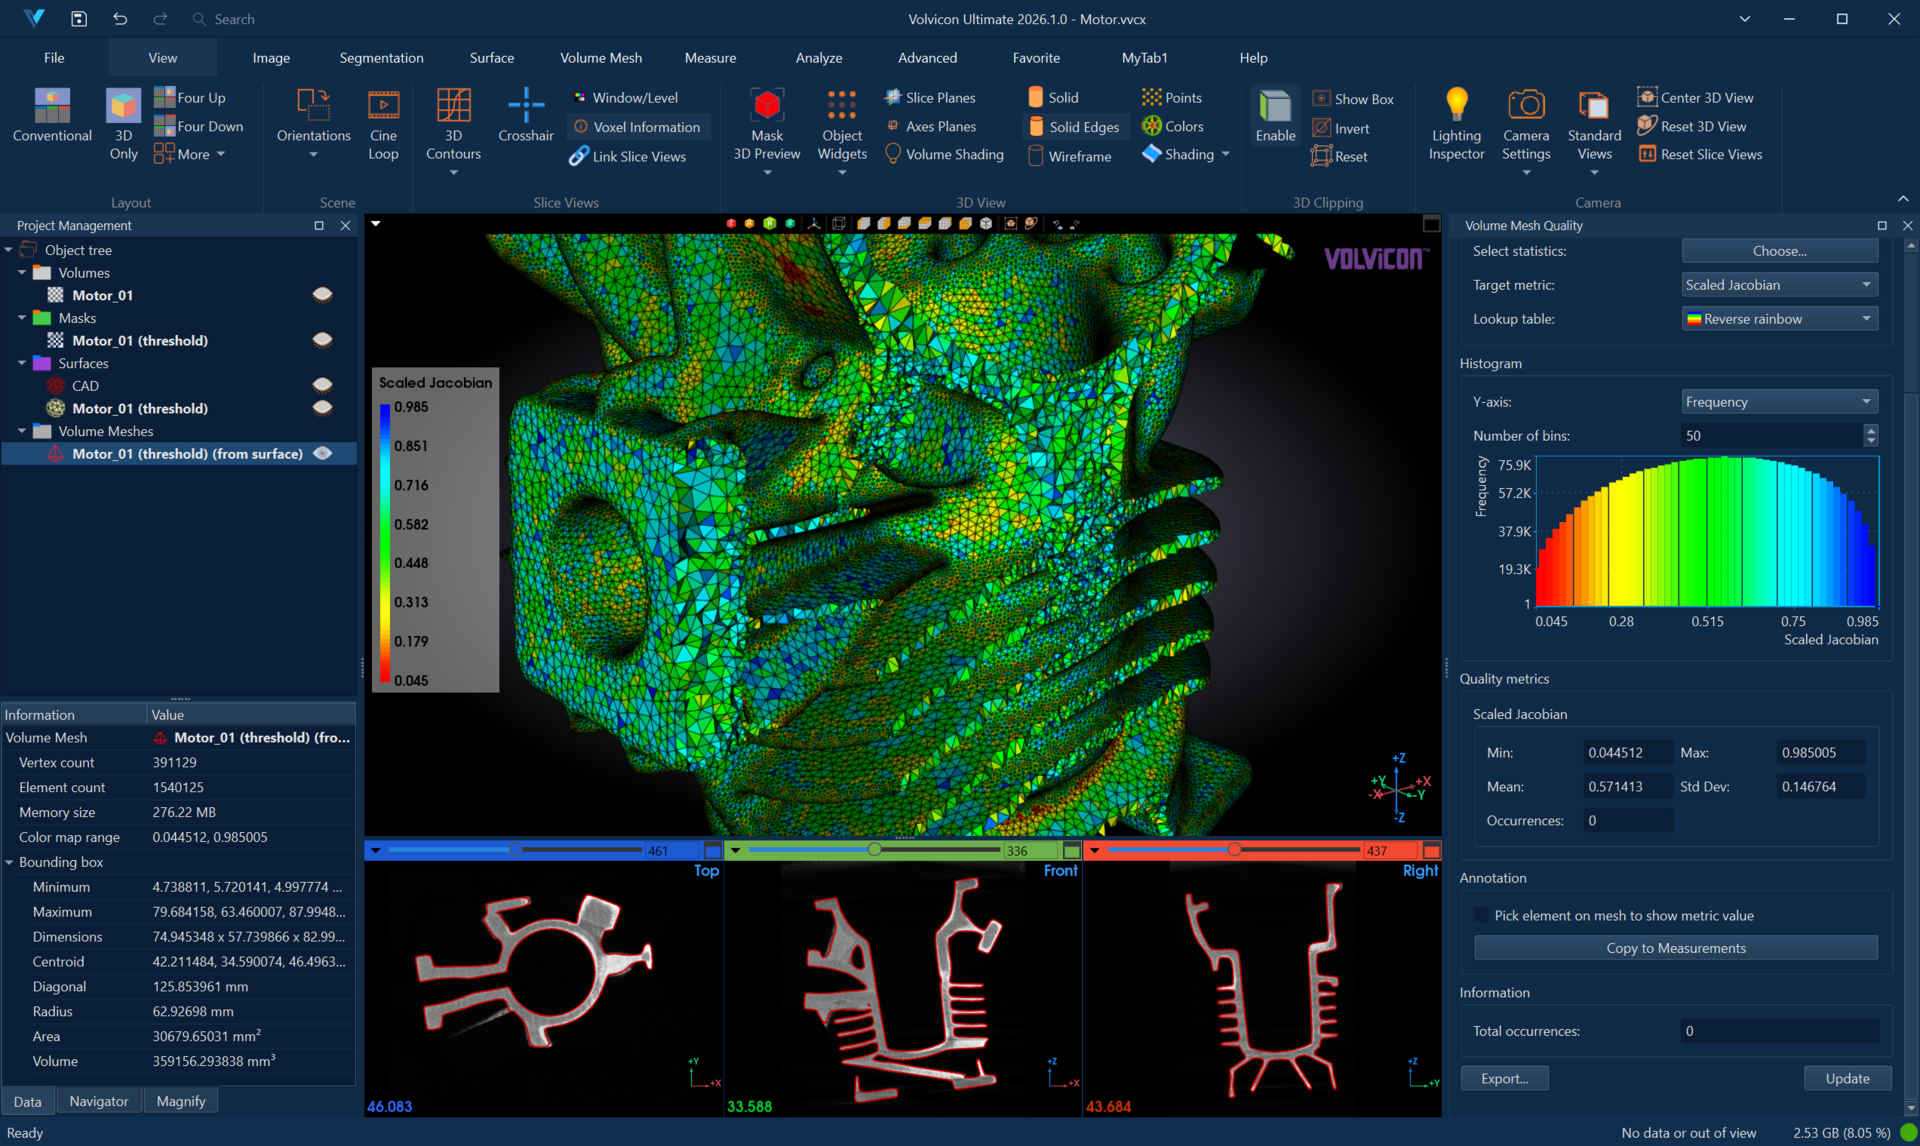
Volume Mesh Quality
Analyze the active volume mesh for element quality. The tool calculates selected quality metrics for all elements, displays their statistical distribution, and provides controls to filter and highlight elements based on metric thresholds in the 3D view.
Options
Control Description Select statistics Choose the quality metrics to analyze Target metric Select the metric for visualization and analysis Lookup table Select the color map for visualizing quality in 3D
Histogram
Control Description Y-axis Frequency or Percentage scale Number of bins Histogram bin count (10–1000, default: 50)
Quality Metrics
Available quality metrics for volume elements include:
Metric Description Ideal Range Volume Element volume Depends on application Aspect Ratio Ratio of dimensions Close to 1 Aspect Frobenius Frobenius norm aspect ratio Close to 1 Collapse Ratio Collapse quality measure > 0 Condition Condition number Close to 1 Distortion Element deformation measure Close to 1 Edge Ratio Max to min edge length ratio Close to 1 Jacobian Jacobian determinant > 0 Scaled Jacobian Scaled Jacobian [-1, 1] Close to 1 Shape Shape quality measure Close to 1 Shape and Size Combined quality measure Close to 1 Shear Shear quality measure Close to 1 Skew Skewness measure Close to 0 Stretch Stretch quality measure Close to 1
Annotation
Option Description Pick element on mesh Click on mesh to highlight element and display metric value Copy to Measurements Copy visible annotation to Measurements panel
Note : Hold the Alt key to enable view spinning while picking elements.
Workflow
Basic Quality Analysis
Select a mesh object (surface or volume)
Open the appropriate quality analyzer
Click Choose... to select quality metrics
Select a target metric for visualization
Click Update to calculate metrics
Review the histogram and quality metrics display
Identify Problem Elements
Generate quality analysis
Review the histogram for outliers
Adjust the threshold range to highlight problem elements
Check Total occurrences for count of elements outside range
Enable Pick element on mesh to inspect individual elements
Prepare for Simulation
Analyze mesh quality before FEA/CFD simulation
Check aspect ratio and Jacobian values
Identify elements that may cause numerical instability
Export quality report for documentation
Button Description Export... Save statistics and histogram to disk Update Recalculate quality metrics
Interpreting Quality Metrics
Good Quality Indicators
Aspect ratio close to 1
Positive Jacobian values
Angles within acceptable ranges (30°–90° for triangles)
Uniform element sizes
Poor Quality Indicators
Very high aspect ratios (elongated elements)
Negative or near-zero Jacobian (inverted/degenerate elements)
Very small or very large angles
Significant size variations