Getting Started with Volvicon
This tutorial introduces the Volvicon application and walks you through opening your first dataset. By the end, you will understand the workspace layout, know how to load volumetric data, and be ready to explore processing and analysis tools.
Estimated time: 15 minutes
Prerequisites:
- Volvicon installed and licensed (see License Guide)
- A volumetric dataset (DICOM, NIfTI, NRRD, or image stack)
The Volvicon Python scripting environment includes support for NumPy, SciPy, Pillow, matplotlib, and pandas. You can start scripting immediately with no additional setup required. See the Batch Processing & Automation tutorial for practical examples and ready-to-run scripts.
Launching Volvicon
- Locate Volvicon in your Start Menu or desktop shortcuts.
- Double-click to launch the application.
- The main window opens with the Home screen displayed.
The Home screen provides quick access to:
- Recent Projects — Previously opened projects for quick resumption
- Recent Folders — Directories you have accessed recently
- Learning Resources — Links to documentation and tutorials
- News — Updates and announcements
On first launch, the Home screen will be empty. After working with projects, your recent items will appear here for convenient access.
Understanding the Workspace
The Volvicon workspace consists of several key areas:
Ribbon Interface
The Ribbon at the top of the window organizes tools into tabs:
| Tab | Purpose |
|---|---|
| File | Project management, import/export, preferences |
| View | Layouts, slice view options, 3D rendering controls |
| Image | Volume processing and transformation tools |
| Segmentation | Mask creation and editing tools |
| Surface | Triangle mesh operations |
| Volume Mesh | Tetrahedral mesh tools for simulation |
| Measure | Measurements, statistics, and primitives |
| Analyze | Quantitative analysis tools |
| Advanced | Scripting and AI segmentation |
| Favorite | Customizable toolbar for frequently used tools |
| Help | Documentation, updates, and license management |
Click any tab to access its tools. The ribbon adapts based on your current selection and loaded data.
View Area
The central area displays your data through four views: the 3D view and three orthogonal slice views. Their names follow the orientation preset chosen in View → Scene → Orientations:
| View | Cross-sections | Name with the default Standard preset | Name with a medical preset |
|---|---|---|---|
| 3D view | - | 3D View | 3D View |
| XY plane | Horizontal | Top View | Plane 3 (XY) View |
| XZ plane | Frontal | Front View | Plane 2 (XZ) View |
| YZ plane | Side | Right View | Plane 1 (YZ) View |
Volvicon starts in the Conventional layout, which puts the 3D view across the top and the three slice views in a row underneath. You can change layouts from the View tab.
Importing a DICOM series switches the scene to the Medical 1 preset automatically, so medical data is presented with the plane names above from the start.
Project Management Dock
The Project Management dock on the left of the window holds the Scene Tree on top and a tabbed panel underneath.
The Scene Tree lists everything in the project under four fixed sections:
- Volumes — 3D image data
- Masks — segmentation results
- Surfaces — triangle meshes
- Volume Meshes — tetrahedral and hexahedral meshes
Click an object's name to select it and make it the active object of its type, shown in bold. Double-click the name to rename it, and click the visibility icon to show or hide it in the views. Right-click a section heading to create or import an object of that type, or right-click an object for the operations that apply to it.
Measurements, primitives, and analyses are not listed here. They have their own editors on the Measure and Analyze tabs.
Data, Navigator, and Magnify
The tabs under the Scene Tree are:
- Data — the properties of the selected object: dimensions, origin, spacing, value range, memory use, and metadata
- Navigator — sliders that move each slice view to a slice index or a physical position
- Magnify — a magnifier overlay for the slice views
Creating Your First Project
Step 1: Open the New Project Dialog
- Click the File tab to open the backstage view.
- Select New from the left navigation panel.
- Choose the appropriate data source for your files.
Step 2: Select Your Data Source
Volvicon supports multiple data formats:
| Source | Use When |
|---|---|
| DICOM | Loading medical imaging data (CT, MRI, PET) |
| 3D Images | Opening structured volume files (MHD, NIfTI, NRRD) |
| 3D Raw Images | Loading raw binary data (requires dimension specification) |
| Image Stack | Combining ordered 2D images (BMP, JPG, PNG, TIF) into a volume |
| Surface CAD/STL Model | Importing triangle meshes (STL, PLY, OBJ, IGES, STEP) |
| Volume Mesh | Loading tetrahedral meshes for simulation |
For this tutorial, we will use the DICOM or 3D Images option.
Step 3: Load DICOM Data
If you have DICOM files:
- Click DICOM in the New panel.
- Navigate to the folder containing your DICOM files.
- Volvicon scans the folder and displays found series.
- Select the series you want to load.
- Click Load to create the project.
DICOM data often contains multiple series (e.g., different scan phases or reconstructions). Review the series descriptions to select the appropriate dataset.
Step 4: Load 3D Image Files
If you have NIfTI, NRRD, or MHD files:
- Click 3D Images in the New panel.
- Navigate to your file location.
- Select the volume file.
- Click Open to load the data.
The volume loads and displays in all views automatically.
Exploring Your Data
With data loaded, take a moment to explore the views:
Navigating Slice Views
In any 2D slice view:
| Action | Mouse/Keyboard |
|---|---|
| Scroll through slices | Mouse wheel |
| Pan the view | Middle-click + drag |
| Zoom in/out | Right-click + drag |
| Reset view | Press R |
Navigating the 3D View
In the 3D view:
| Action | Mouse/Keyboard |
|---|---|
| Rotate | Left-click + drag |
| Pan | Middle-click + drag |
| Zoom | Mouse wheel or Right-click + drag |
| Reset view | Press R |
Adjusting Window/Level (Contrast)
The window/level settings control how intensity values map to displayed brightness:
-
Navigate to the View tab.
-
Click Window/Level in the Slice Views section.
-
The Window/Level panel opens with:
- Presets for common tissue types
- Window slider (contrast range)
- Level slider (brightness center)
- Lookup Tables for color mapping
-
Drag the sliders or select a preset to optimize visualization.
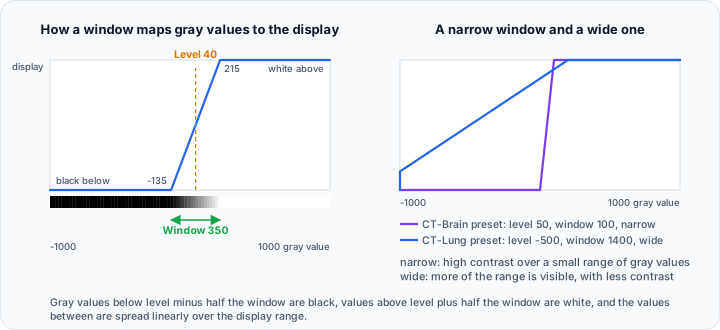
In slice views, drag the mouse:
- Horizontal movement adjusts Window (contrast)
- Vertical movement adjusts Level (brightness)
Saving Your Project
After loading and configuring your data:
- Click the File tab.
- Select Save As.
- Choose a location and enter a project name.
- Click Save.
Volvicon projects are saved as .vvcx files containing all scene objects and settings.
Complex analysis sessions should be saved regularly. Use Ctrl + S for quick saves to the current project file.
Understanding the Project Structure
A Volvicon project can contain multiple objects:
Project.vvcx
├── Volumes (grayscale 3D images)
│   └── CT_Head (512 × 512 × 300)
├── Masks (binary/label segmentations)
│   └── Bone_Mask
├── Surfaces (triangle meshes)
│   └── Skull_Surface
├── Volume Meshes (tetrahedral meshes)
└── Measurements
    └── Distance_1
Objects can reference each other—for example, a mask is typically created from a volume, and a surface is generated from a mask.
Workflow Summary
The typical Volvicon workflow follows this pattern:
Import Data → Preprocess → Segment → Generate Surfaces → Analyze → Export
- Import — Load DICOM, NIfTI, or other volumetric data
- Preprocess — Crop, resample, or filter the volume as needed
- Segment — Create masks to isolate structures of interest
- Generate Surfaces — Convert masks to triangle meshes for visualization or export
- Analyze — Perform measurements, statistics, or quality analysis
- Export — Save results as images, meshes, reports, or data files
Next Steps
You now understand the Volvicon workspace and can load volumetric data. Continue with these tutorials:
- Navigating the Interface — Learn advanced view controls and layout options
- Working with Volume Data — Explore image processing and transformation tools
- Threshold Segmentation — Create your first segmentation mask
Quick Reference
| Task | Location |
|---|---|
| Create new project | File → New |
| Open existing project | File → Open |
| Save project | File → Save or Ctrl + S |
| Change layout | View → Layout |
| Adjust contrast | View → Window/Level |
| Access documentation | Help → User Guide |
Troubleshooting
Data does not display correctly
- Verify the file format is supported
- Check that DICOM files are complete (not truncated)
- For raw data, ensure dimensions and spacing are specified correctly
Views appear black or white
- Adjust Window/Level settings from the View tab
- Use Auto in the Window/Level panel to calculate optimal values
- Verify the data contains valid intensity values
Application runs slowly
- Large datasets may require more memory
- Consider cropping to a region of interest
- Check system requirements in Help → System Information