Window/Level
Window/Level opens a control panel for the brightness and contrast of the slice views. The settings map the gray values of the active volume to the visible grayscale or color range. They affect the display only; the image data is never changed.
Opening the Tool
- Open the View tab in the ribbon.
- Click Window/Level in the Slice Views section.
The Window / Level panel opens in the task dock.
An active volume must be loaded in the project.
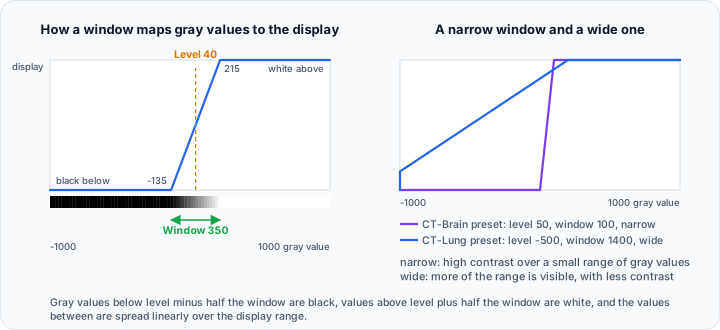
Understanding Window and Level
- Level is the center gray value of the display range.
- Window is the width of the range around the level.
Gray values below (Level - Window/2) are shown with the lowest display value, normally black. Gray values above (Level + Window/2) are shown with the highest display value, normally white. A narrow window gives high contrast over a small range of gray values; a wide window shows more of the range with less contrast.
Controls
| Control | Function |
|---|---|
| Presets | Apply a stored window, level, and lookup table |
| Histogram | Gray value distribution of the volume, with the two range boundaries drawn as draggable lines on it |
| Min/Max inputs | Set the range boundaries directly |
| Auto | Calculate values from the image content |
| Full Range | Use the complete gray value range of the volume |
| Lookup table | Choose the color map the gray values are shown with |
Histogram
The histogram is drawn in the Interactive Histogram Chart. The two boundaries on it act as a mirrored pair:
- Drag either line to set the window. The two lines move apart or together and the level stays where it is.
- Drag the shaded area between them to set the level. The range moves and the window stays the same.
Scroll to zoom into a narrow band of gray values, and right-click to reach the display options. This histogram is a preview for setting the window and level, not measurement data, so the CSV export of the chart is not offered here. Copying it to the clipboard and saving it as a picture still are.
Lookup Tables
The lookup table selects how gray values are turned into colors:
- Grayscale maps black to white.
- Inverted maps white to black.
- Color maps apply a false-color mapping, such as thermal or rainbow.
The color map bar next to the selection shows the colors that are currently displayed. Lookup tables help to separate gray value ranges that are hard to tell apart in grayscale.
Mouse Adjustment
While the panel is open, the window and the level can be set directly in the slice views by dragging with the left mouse button:
- Drag horizontally to change the window.
- Drag vertically to change the level.
The views update while dragging, and the panel follows the values. Closing the panel turns the adjustment off again.
Slice Display and Window/Level
The window and the level reach the slice views only in the Standard slice display. The two gray value interval modes described under Slice Display define the displayed colors themselves, so while one of them is in effect:
- the controls of this panel are disabled;
- the mouse adjustment in the slice views does nothing.
The values themselves are kept, so switching back to Standard restores the previous display exactly.
Opening Window/Level while the slice views are in one of the interval modes therefore asks whether Slice Display should be changed to Standard. Answer Yes to switch and work with the panel right away, or No to keep the interval colors. Select Do not show this message again in the question to stop it from appearing; the setting is stored per user and applies to every project.
Window/level settings affect visualization only. The underlying image data remains unchanged.
Presets
A preset stores a window, a level, and a lookup table. Selecting one applies all three to the active volume immediately. Each entry shows a thumbnail of the middle axial slice rendered with that preset, so the list can be compared at a glance.
These presets are supplied by default:
| Preset | Level | Window | Use Case |
|---|---|---|---|
| CT-Bone | 400 | 1000 | Skeletal structures |
| CT-Air | -426 | 1000 | Airways and cavities |
| CT-Brain | 50 | 100 | Brain tissue |
| CT-Abdomen | 40 | 350 | Abdominal organs |
| CT-Lung | -500 | 1400 | Pulmonary tissue |
| Blood | 100 | 600 | Vascular structures |
| Water | 0 | 10 | Water equivalent density |
| Heart | 200 | 600 | Cardiac structures |
| CT-PET | 6000 | 10000 | Fused PET intensity range |

Managing Presets
The tool button next to the list opens the preset operations menu:
| Entry | Function |
|---|---|
| Save a New Preset... | Store the current settings under a new name |
| Save Settings to Selected Preset | Overwrite the selected preset with the current settings |
| Save Presets As... | Write the whole list to an XML file |
| Load Presets... | Replace the list with the presets from an XML file |
| Remove Selected Preset | Delete the selected preset |
| Restore to Default Presets | Discard the list and bring back the presets above |
The list is stored per user, so it is kept across projects and sessions.
Workflows
Optimizing Window/Level for CT Bone Visualization
- Open the View tab and click Window/Level in the Slice Views section.
- From the Presets list, select CT-Bone (Level 400, Window 1000).
- The slice views update immediately to show bone structures with high contrast.
- Fine-tune the window by dragging either boundary line; drag the shaded area to adjust the level.
Setting Custom Window/Level Values
- Open Window/Level from the View tab.
- Drag either boundary line to set the window, then drag the shaded area to set the level.
- To set the boundaries independently, enter exact values in the Min and Max input fields.
- Click Auto to calculate values from the image content.
- Click Full Range to use the entire gray value range.
Applying a Color Lookup Table
- Open Window/Level from the View tab.
- In the Lookup table section, open the color map list.
- Select a color map, for example thermal or rainbow.
- The slice views show the gray values with the selected mapping.
🐍 Scripting
The window and the level of the active volume are available through the view operations object:
import ScriptingApi as api

app = api.Application()
view = app.get_view_operations()

# Read the current values: [window, level]
wl = view.get_window_level()
print(f"Window: {wl[0]}, Level: {wl[1]}")

# CT bone visualization
view.set_window_level(1000.0, 500.0)

# CT soft tissue
view.set_window_level(400.0, 40.0)

# CT lung
view.set_window_level(500.0, -200.0)
The window must be zero or larger. The values are always stored with the active volume. While the slice views are in one of the gray value interval modes, they are stored but not displayed until Slice Display is set back to Standard from the ribbon, a slice view right-click menu, or a 2D view controller.
Related Topics
- Slice Views - Slice view display options, including Slice Display
- 2D Views - Mouse interaction in the slice views
- Render Properties - Gray value intervals, colors, and opacity curves
- Interactive Histogram Chart - The chart the histogram is drawn in