Curvature Analysis
The Curvature Analysis tool calculates and visualizes surface curvature properties at every point on a mask or surface object. Curvature measurements quantify how much a surface deviates from being flat, providing insights into surface shape characteristics, identifying regions of high bending, and supporting applications in shape analysis, surface quality assessment, and geometric feature detection.
Understanding Surface Curvature
Curvature is a fundamental geometric property that describes how a surface bends at each point. At any location on a surface, there are infinitely many ways to measure curvature depending on the direction considered. Two principal curvatures—the maximum and minimum—capture the extreme bending characteristics. From these principal values, various curvature metrics can be derived.
The analysis produces a continuous scalar field mapped to the object geometry, enabling visual identification of flat regions, peaks, valleys, saddle points, and areas of high curvature that may indicate geometric features or surface quality issues.
For a surface in 3D space, the principal curvatures and represent the maximum and minimum rates of curvature at each point. The Gaussian curvature and mean curvature are derived from these principal values.
Curvature Types
The tool provides four curvature calculation methods:
| Method | Formula | Description |
|---|---|---|
| Gaussian | Product of principal curvatures. Represents intrinsic surface curvature. Positive for dome/bowl shapes, negative for saddle shapes, zero for flat or cylindrical surfaces. | |
| Mean | Average of principal curvatures. Indicates overall bending intensity. Zero for minimal surfaces. | |
| Maximum | Strongest bending direction. Highlights areas of sharpest curvature. | |
| Minimum | Weakest bending direction. Useful for identifying cylindrical or ridge-like features. |
Interpreting Curvature Values
| Surface Type | Gaussian | Mean | Example |
|---|---|---|---|
| Flat plane | 0 | 0 | Table top |
| Sphere (convex) | Positive | Positive | Ball exterior |
| Bowl (concave) | Positive | Negative | Bowl interior |
| Cylinder | 0 | Non-zero | Pipe surface |
| Saddle | Negative | Near zero | Saddle or Pringle shape |
| Sharp ridge | High | High | Edge or crease |
Accessing the Tool
- Navigate to the Analyze ribbon tab.
- Click the Curvature Analysis button.
- Select the analysis mode from the dropdown menu:
- Analyze Mask – Analyze curvature on a mask object's 3D preview surface.
- Analyze Surface – Analyze curvature on a triangle mesh surface object.
Analysis Configuration
Creating a New Analysis
- In the Analysis Selection section, click Select analysis to open the Curvature Analysis Editor dialog.
- Click New Analysis to create a new analysis configuration.
- Configure the analysis parameters (detailed below).
- Click Load to load the selected analysis and close the dialog.
Analysis Parameters
| Parameter | Description |
|---|---|
| Analysis Name | User-defined name for the analysis. Double-click to rename. |
| Actual Object | The mask or surface object to analyze. |
| Surface Quality | (Mask analysis only) Quality of the 3D preview surface: Optimal, High, Medium, or Low. |
| Method | Curvature calculation type: Gaussian, Mean, Maximum, or Minimum. |
| Above Max. Range Color | Color displayed for curvature values above the visualization range. |
| LUT | Lookup table (color map) for visualizing curvature values. |
| Below Min. Range Color | Color displayed for curvature values below the visualization range. |
| Range | Current visualization range (read-only, updated after analysis). |
Method Selection Guidelines
Gaussian Curvature
Use Gaussian curvature when you need to:
- Distinguish between different surface types (spherical, cylindrical, saddle)
- Identify topological features
- Detect flat or developable surfaces (Gaussian curvature = 0)
Note: Gaussian curvature can have very large positive or negative values at sharp features, requiring careful range adjustment for visualization.
Mean Curvature
Use mean curvature when you need to:
- Assess overall surface bending intensity
- Compare curvature magnitudes across regions
- Identify areas of high vs. low curvature
Mean curvature provides a balanced view that is often easier to interpret than Gaussian curvature.
Maximum Curvature
Use maximum curvature when you need to:
- Locate the sharpest features on a surface
- Identify edges, ridges, and high-stress areas
- Find regions of maximum bending for structural analysis
Minimum Curvature
Use minimum curvature when you need to:
- Identify cylindrical or ruled surfaces
- Detect ridge lines and valley features
- Analyze surfaces with directional bending characteristics
For general surface quality assessment, start with Mean curvature as it provides an intuitive overview. Use Gaussian for more detailed shape classification. Use Maximum to find the sharpest features.
Running the Analysis
- After loading an analysis configuration, click Run Analysis.
- A progress dialog appears while the analysis computes.
- Upon completion:
- The object displays color-mapped curvature values in 3D and 2D views.
- The histogram updates with the curvature distribution.
- The statistics table populates with summary metrics.
Interpreting Results
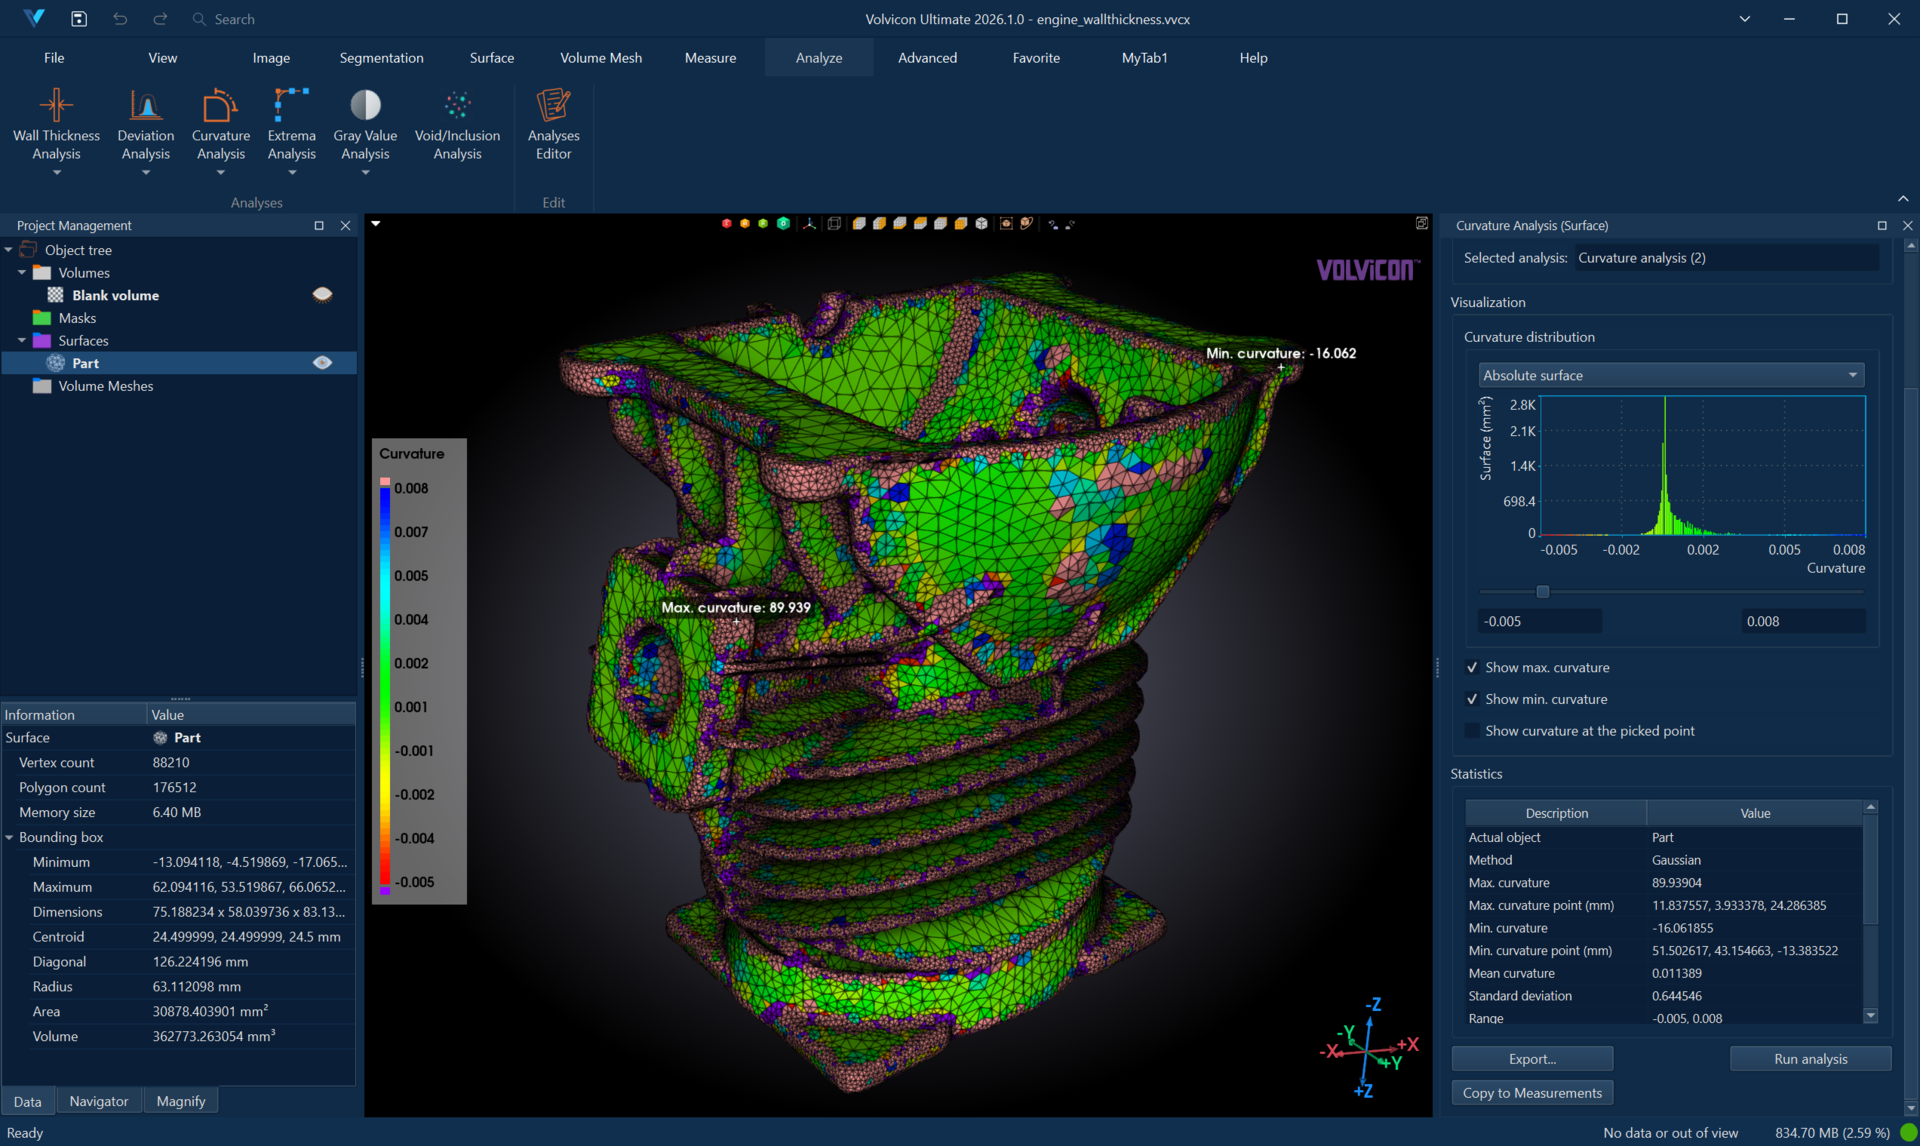
Visualization
The analyzed object displays a color gradient representing curvature values:
- Cool colors (blue): Lower or negative curvature values.
- Neutral colors (green/yellow): Near-zero or moderate curvature.
- Warm colors (red): Higher or positive curvature values.
Adjust the histogram range sliders to focus on specific curvature intervals and enhance visualization of regions of interest.
Statistics
The statistics table displays key metrics:
| Statistic | Description |
|---|---|
| Actual Object | Name of the analyzed object. |
| Method | Curvature calculation method used. |
| Maximum Curvature | Highest curvature value on the surface. |
| Maximum Curvature Point | Coordinates of the maximum curvature location. |
| Minimum Curvature | Lowest curvature value on the surface. |
| Minimum Curvature Point | Coordinates of the minimum curvature location. |
| Mean Curvature Value | Average curvature across all points. |
| Standard Deviation | Variation in curvature values. |
| Range | Current visualization range. |
| Area Below Min. Range (%) | Percentage of surface below the minimum range. |
| Area Above Max. Range (%) | Percentage of surface above the maximum range. |
| Area Within Range (%) | Percentage of surface within the selected range. |
Interactive Features
| Feature | Description |
|---|---|
| Show Maximum | Displays an annotation at the point of highest curvature. |
| Show Minimum | Displays an annotation at the point of lowest curvature. |
| Pick Point | Enable interactive picking to display curvature at any clicked location. |
Typical Workflows
Surface Quality Assessment
- Import or generate the surface to be evaluated.
- Create a new Curvature Analysis with Mean method.
- Run the analysis.
- Adjust the range to highlight regions of high curvature.
- Use Show Maximum to locate the sharpest features.
- Export results for documentation.
Identifying Geometric Features
- Analyze a surface using Gaussian curvature.
- Look for:
- Positive regions: Dome-like or bowl-like areas
- Negative regions: Saddle points and anticlastic surfaces
- Zero regions: Flat or cylindrical areas
- Use Maximum curvature to locate edges and ridges.
Design Smoothness Verification
- Analyze the designed surface using Maximum curvature.
- Set the visualization range to acceptable curvature limits.
- Identify regions exceeding the threshold.
- Use the results to guide surface refinement.
Anatomical Structure Analysis
- Segment the anatomical structure and generate a surface.
- Analyze using Mean curvature to understand overall shape.
- Use Gaussian curvature to identify convex vs. concave regions.
- Document curvature characteristics for morphological studies.
Exporting Results
CSV Export
Click Export and select CSV to save:
- Statistical summary data
- Curvature distribution histogram data
- Per-point curvature values (optional)
PDF Report
Click Export and select PDF Report to generate a formatted document containing:
- Analysis configuration and parameters
- 3D visualization screenshots
- Histogram and statistics
- Curvature location annotations
See PDF Report for detailed report customization options.
Best Practices
-
Ensure mesh quality: Curvature calculations are sensitive to mesh quality. Smooth or remesh surfaces with noise before analysis.
-
Use appropriate surface quality: For mask analyses, higher surface quality provides more accurate curvature estimates, especially for complex geometry.
-
Adjust the range carefully: Curvature values can span a wide range. Adjust the visualization range to focus on the curvature values of interest.
-
Consider the scale: Curvature values depend on the object size. Larger objects generally have lower curvature values than smaller objects.
-
Compare using consistent methods: When comparing multiple objects, use the same curvature method and visualization range.
Troubleshooting
| Issue | Possible Cause | Solution |
|---|---|---|
| Very noisy curvature map | Rough or noisy mesh | Apply smoothing to the surface before analysis |
| Extreme values dominating the visualization | Sharp features or mesh artifacts | Adjust the visualization range to exclude outliers |
| Unexpected zero curvature | Flat or nearly flat surface | This may be correct; verify the geometry |
| Curvature calculation fails | Degenerate triangles in mesh | Run Diagnostics and Fixes to repair mesh issues |
Related Resources
- Analyze Tab Overview – Overview of all analysis tools
- Extrema Analysis – Find maximum and minimum points along a direction
- Surface Smooth – Reduce surface noise before analysis
- Surface Remesh – Improve mesh quality for better analysis
- PDF Report – Generate analysis reports
- Analysis Operations API – Scripting support for analysis automation