Wall Thickness Analysis
The Wall Thickness Analysis tool measures material thickness at every point on a mask or surface object, providing color-mapped visualizations and statistical data to identify thin-wall regions, verify manufacturing tolerances, and assess structural integrity. This analysis is fundamental for quality control in additive manufacturing, casting inspection, and design validation workflows.
Understanding Wall Thickness Measurement
Wall thickness measurement determines the shortest distance from each point on an object's outer surface to the opposing inner boundary. For solid objects, this represents the material thickness at that location. The analysis produces a continuous scalar field mapped to the object geometry, enabling immediate visual identification of regions that may be structurally weak or outside design specifications.
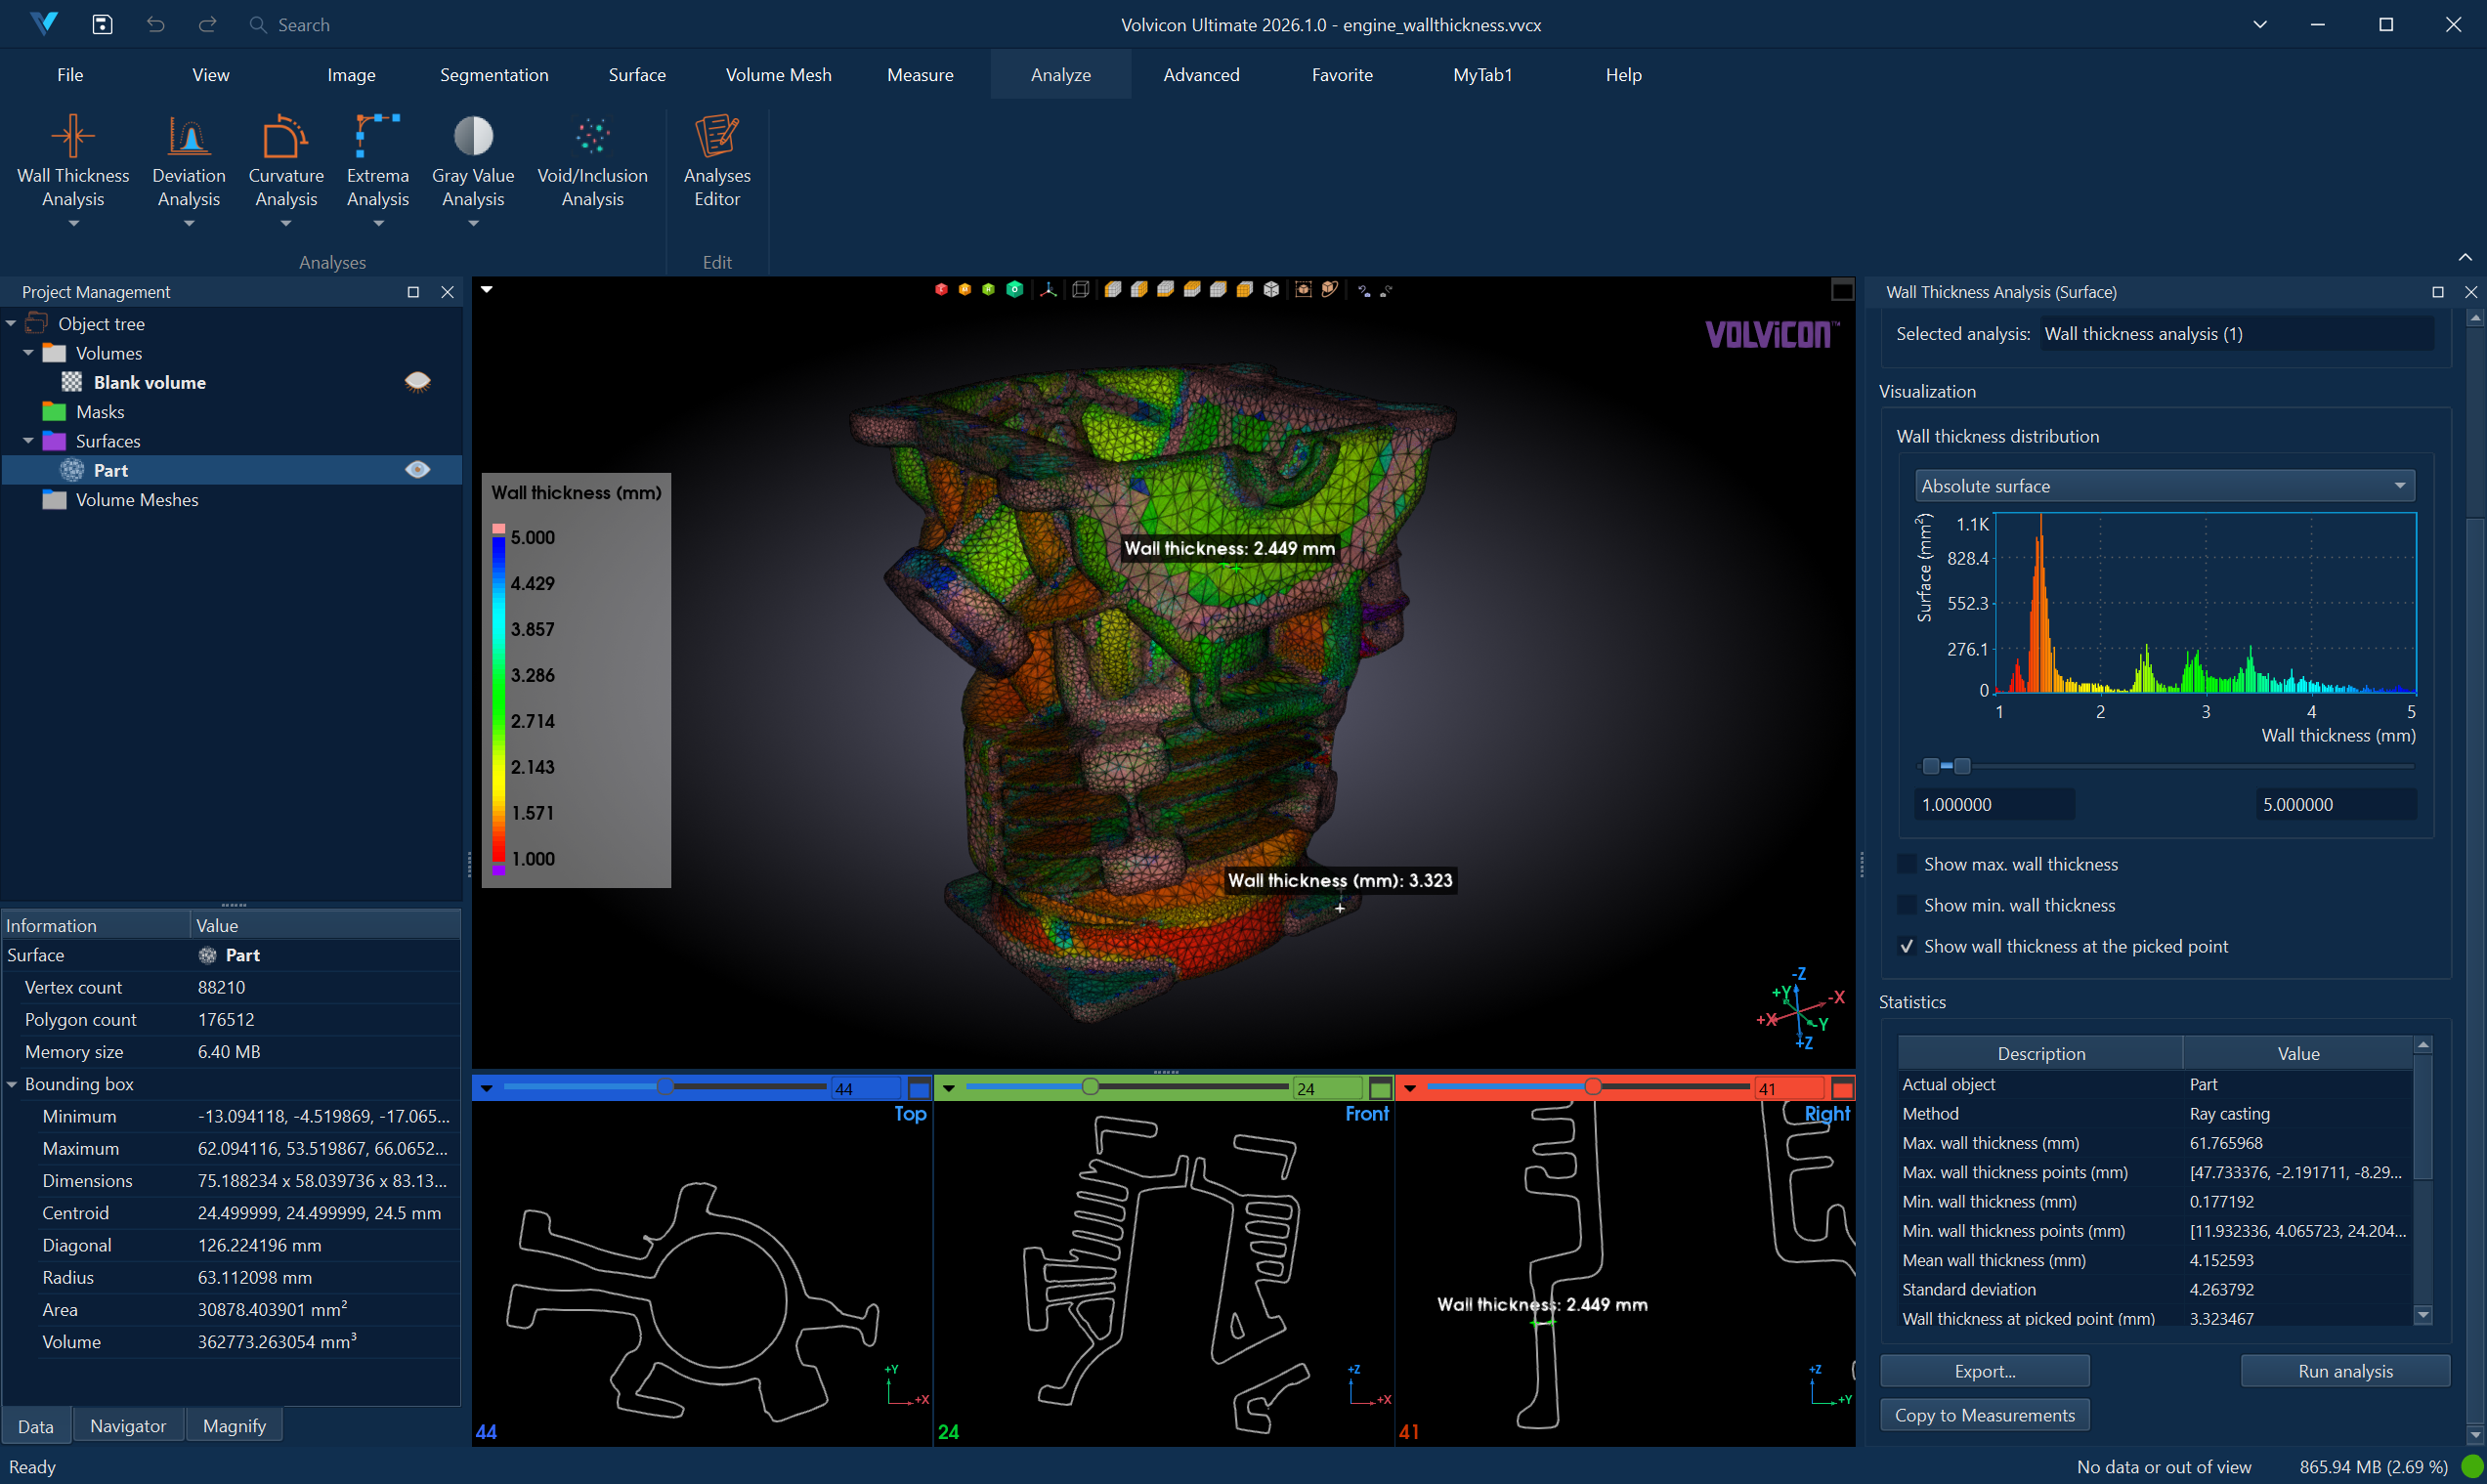
The computed thickness values are displayed as a color gradient on the object surface, with accompanying statistics and histogram visualization showing the distribution of thickness values across the entire part.
Wall thickness measurements are provided for research and quality assessment purposes. Results should be validated by qualified engineers or professionals before making manufacturing, structural, or clinical decisions. Measurement accuracy depends on mesh quality, algorithm parameters, and object geometry.
Accessing the Tool
- Navigate to the Analyze ribbon tab.
- Click the Wall Thickness Analysis button.
- Select the analysis mode from the dropdown menu:
- Analyze Mask – Analyze wall thickness on a mask object's 3D preview surface.
- Analyze Surface – Analyze wall thickness on a triangle mesh surface object.
Analysis Configuration
Creating a New Analysis
- In the Analysis Selection section, click Select analysis to open the Wall Thickness Analysis Editor dialog.
- Click New Analysis to create a new analysis configuration. A new row appears in the table.
- Configure the analysis parameters (detailed below).
- Click Load to load the selected analysis and close the dialog.
Analysis Parameters
The Wall Thickness Analysis Editor provides the following configuration options:
| Parameter | Description |
|---|---|
| Analysis Name | User-defined name for the analysis. Double-click to rename. |
| Actual Object | The mask or surface object to analyze. |
| Surface Quality | (Mask analysis only) Quality of the 3D preview surface: Optimal, High, Medium, or Low. Higher quality provides more accurate results but increases computation time. |
| Method | Algorithm used for thickness calculation: Ray Casting or Shrinking Sphere. |
| Max. Wall Thickness (mm) | Maximum thickness to search for. Set to 0 for unlimited search, or specify a value to limit the search range and improve performance. |
| Search Angle (deg) | Cone angle for finding opposite surface points. Wider angles detect points on coarse meshes but may reduce accuracy. |
| Above Max. Range Color | Color displayed for thickness values above the visualization range. |
| LUT | Lookup table (color map) for visualizing thickness values. |
| Below Min. Range Color | Color displayed for thickness values below the visualization range. |
| Range (mm) | Current visualization range (read-only, updated after analysis). |
Calculation Methods
The tool provides two algorithms for calculating wall thickness:
Ray Casting (Bidirectional)
The ray casting method projects rays from each surface point along the surface normal in both directions (inward and outward) to find the opposing surface intersection. This method is:
- Fast: Efficient for large meshes and typical geometries.
- Accurate for parallel surfaces: Works well when inner and outer surfaces are roughly parallel.
- Suitable for: Thin-walled structures, shells, and objects with consistent wall geometry.
Shrinking Sphere
The shrinking sphere method determines thickness by fitting the largest sphere that touches both the inner and outer surfaces while centered on the normal line. Starting from each point, the algorithm finds the smallest sphere that contacts both boundaries. This method is:
- More accurate for curved surfaces: Handles non-parallel and complex surface relationships.
- Better for variable geometry: Provides more meaningful results for organic shapes and tapered walls.
- Computationally intensive: Slower than ray casting but produces more robust results for challenging geometries.
For initial exploration, use Ray Casting for faster results. Switch to Shrinking Sphere when analyzing curved or complex geometries where ray casting may produce artifacts.
Search Parameters
Maximum Wall Thickness
This parameter limits the search distance for finding opposing surfaces:
- Set to 0 to search the entire object without limits.
- Set to a specific value when you know the approximate maximum thickness, improving performance by avoiding unnecessary calculations.
- For best performance, set this value slightly larger than the expected maximum thickness.
Search Angle
The search angle defines a cone around each surface normal within which the algorithm looks for opposing surface points:
- Smaller angles (5–15°): More accurate results for high-quality meshes with smooth geometry.
- Larger angles (20–45°): Better detection on coarse meshes or surfaces with high curvature, at the cost of some accuracy.
Running the Analysis
- After loading an analysis configuration, click Run Analysis.
- A progress dialog appears while the analysis computes.
- Upon completion:
- The object displays color-mapped thickness values in 3D and 2D views.
- The histogram updates with the thickness distribution.
- The statistics table populates with summary metrics.
Interpreting Results
Visualization
The analyzed object displays a color gradient representing thickness values:
- Cool colors (blue/green): Lower thickness values.
- Warm colors (yellow/red): Higher thickness values.
- Below range color: Indicates regions thinner than the selected minimum range.
- Above range color: Indicates regions thicker than the selected maximum range.
Use the histogram range sliders to focus on specific thickness intervals and identify regions of interest.
Statistics
The statistics table displays key metrics:
| Statistic | Description |
|---|---|
| Minimum | Thinnest region on the object (mm). |
| Maximum | Thickest region on the object (mm). |
| Mean | Average thickness across all analyzed points (mm). |
| Standard Deviation | Variation in thickness values (mm). |
| Surface Area | Total analyzed surface area (mm²). |
| Surface Area in Range | Area with thickness values within the selected range (mm²). |
| Relative Surface Area in Range | Percentage of surface within the selected range (%). |
Interactive Features
| Feature | Description |
|---|---|
| Show Maximum | Displays an annotation at the thickest point, showing the location and value. |
| Show Minimum | Displays an annotation at the thinnest point, showing the location and value. |
| Pick Point | Enable interactive picking to display thickness at any clicked location on the object. |
When picking points on mask-based analyses, the 2D slice views automatically update to center on the selected location.
Typical Workflows
Quality Control for Additive Manufacturing
- Import or segment the printed part.
- Create a new Wall Thickness Analysis for the part.
- Set the method to Shrinking Sphere for curved geometries.
- Set Max. Wall Thickness to slightly exceed the design maximum.
- Run the analysis.
- Use the histogram to identify regions below the minimum specification.
- Enable Show Minimum to locate the thinnest area.
- Export a PDF report for documentation.
Design Validation
- Generate a surface from the CAD design or segmentation.
- Configure Wall Thickness Analysis with appropriate parameters.
- Run the analysis to visualize thickness distribution.
- Adjust the range sliders to highlight regions outside tolerance.
- Use Copy to Measurements to transfer annotations for reporting.
Comparing Manufacturing Variations
- Create separate analyses for each part variation.
- Use consistent parameters across all analyses.
- Compare statistics tables to identify differences.
- Generate reports for each analysis for side-by-side comparison.
Exporting Results
CSV Export
Click Export and select CSV to save:
- Statistical summary data
- Thickness distribution histogram data
- Per-point thickness values (optional)
PDF Report
Click Export and select PDF Report to generate a formatted document containing:
- Analysis configuration and parameters
- 3D visualization screenshots
- Histogram and statistics
- Minimum and maximum location annotations
See PDF Report for detailed report customization options.
Best Practices
-
Verify mesh quality: Run Diagnostics and Fixes on surfaces before analysis to ensure accurate results.
-
Start with conservative parameters: Use default settings initially, then refine based on results.
-
Match surface quality to requirements: For mask analyses, use Optimal quality for final reports and Medium for quick exploration.
-
Consider geometry when selecting method: Ray Casting for simple shapes; Shrinking Sphere for complex curves.
-
Document analysis parameters: Include parameter settings in reports for reproducibility.
-
Validate against known references: When possible, compare results against physical measurements or known CAD dimensions.
Troubleshooting
| Issue | Possible Cause | Solution |
|---|---|---|
| Analysis shows unexpected zero values | Maximum wall thickness too small | Increase the Max. Wall Thickness parameter |
| Noisy thickness map | Coarse mesh or high surface curvature | Use Shrinking Sphere method; increase surface quality for masks |
| Missing thickness in some regions | Non-manifold mesh or holes | Run Diagnostics and Fixes to repair the surface |
| Long computation time | Very fine mesh or unlimited search | Set a reasonable Max. Wall Thickness limit |
Related Resources
- Analyze Tab Overview – Overview of all analysis tools
- Deviation Analysis – Compare objects to identify geometric differences
- Surface Diagnostics and Fixes – Repair mesh issues before analysis
- PDF Report – Generate analysis reports
- Analysis Operations API – Scripting support for analysis automation