Extrema Analysis
The Extrema Analysis tool identifies and visualizes local maximum and minimum points on a mask or surface object along a specified direction vector. This analysis is useful for finding peaks and valleys, measuring dimensional extents, locating feature points, and understanding the geometric distribution of an object relative to a reference axis.
Understanding Extrema Detection
Extrema analysis projects surface points onto a direction vector and identifies where the surface reaches its highest (maximum) and lowest (minimum) values along that direction. The analysis produces both:
- Global extrema: The absolute maximum and minimum points on the entire surface.
- Local extrema: Points where the surface changes from increasing to decreasing (local maxima) or decreasing to increasing (local minima) along the specified direction.
The results are visualized as a color-mapped scalar field representing the projection distance of each point onto the direction vector, making it easy to understand the object's extent and identify extreme points.
Accessing the Tool
- Navigate to the Analyze ribbon tab.
- Click the Extrema Analysis button.
- Select the analysis mode from the dropdown menu:
- Analyze Mask – Analyze extrema on a mask object's 3D preview surface.
- Analyze Surface – Analyze extrema on a triangle mesh surface object.
Analysis Configuration
Creating a New Analysis
- In the Analysis Selection section, click Select analysis to open the Extrema Analysis Editor dialog.
- Click New Analysis to create a new analysis configuration.
- Configure the analysis parameters (detailed below).
- Click Load to load the selected analysis and close the dialog.
Analysis Parameters
| Parameter | Description |
|---|---|
| Analysis Name | User-defined name for the analysis. Double-click to rename. |
| Actual Object | The mask or surface object to analyze. |
| Surface Quality | (Mask analysis only) Quality of the 3D preview surface: Optimal, High, Medium, or Low. |
| Method | Extrema detection type: Maximum, Minimum, or Maximum & Minimum. |
| Axis | Direction vector along which to find extrema. Click to open the axis selection dialog. |
| Above Max. Range Color | Color displayed for values above the visualization range. |
| LUT | Lookup table (color map) for visualizing projection values. |
| Below Min. Range Color | Color displayed for values below the visualization range. |
| Range | Current visualization range (read-only, updated after analysis). |
Detection Methods
Maximum
Identifies the absolute and local maxima on the surface—points where the object reaches its highest position along the specified direction. These represent:
- Peak areas: Points at the top of hills or protrusions
- Convex features: Areas where the surface curves outward relative to the direction
Minimum
Identifies the absolute and local minima on the surface—points where the object reaches its lowest position along the specified direction. These represent:
- Valley areas: Points at the bottom of depressions
- Concave features: Areas where the surface curves inward relative to the direction
Maximum & Minimum
Combines both analyses to detect all extrema, providing a comprehensive view of both peaks and valleys across the surface. This is useful when you need to understand the full topographic character of the object.
Direction Vector (Axis)
The direction vector defines the axis along which extrema are calculated:
| Axis | Vector | Description |
|---|---|---|
| X-axis | (1, 0, 0) | Left-right direction |
| Y-axis | (0, 1, 0) | Front-back direction |
| Z-axis | (0, 0, 1) | Up-down direction (default) |
| Custom | (x, y, z) | Any user-defined direction |
Click the Axis button in the editor to open a dialog where you can:
- Select a predefined axis (X, Y, or Z)
- Enter custom direction vector components
Common use cases:
- Use (0, 0, 1) for height/elevation analysis
- Use (0, 1, 0) for depth measurements
- Use custom vectors for oblique or tilted reference directions
Running the Analysis
- After loading an analysis configuration, click Run Analysis.
- A progress dialog appears while the analysis computes.
- Upon completion:
- The object displays color-mapped projection values in 3D and 2D views.
- The histogram updates with the distribution of projection values.
- The statistics table populates with extrema locations and summary metrics.
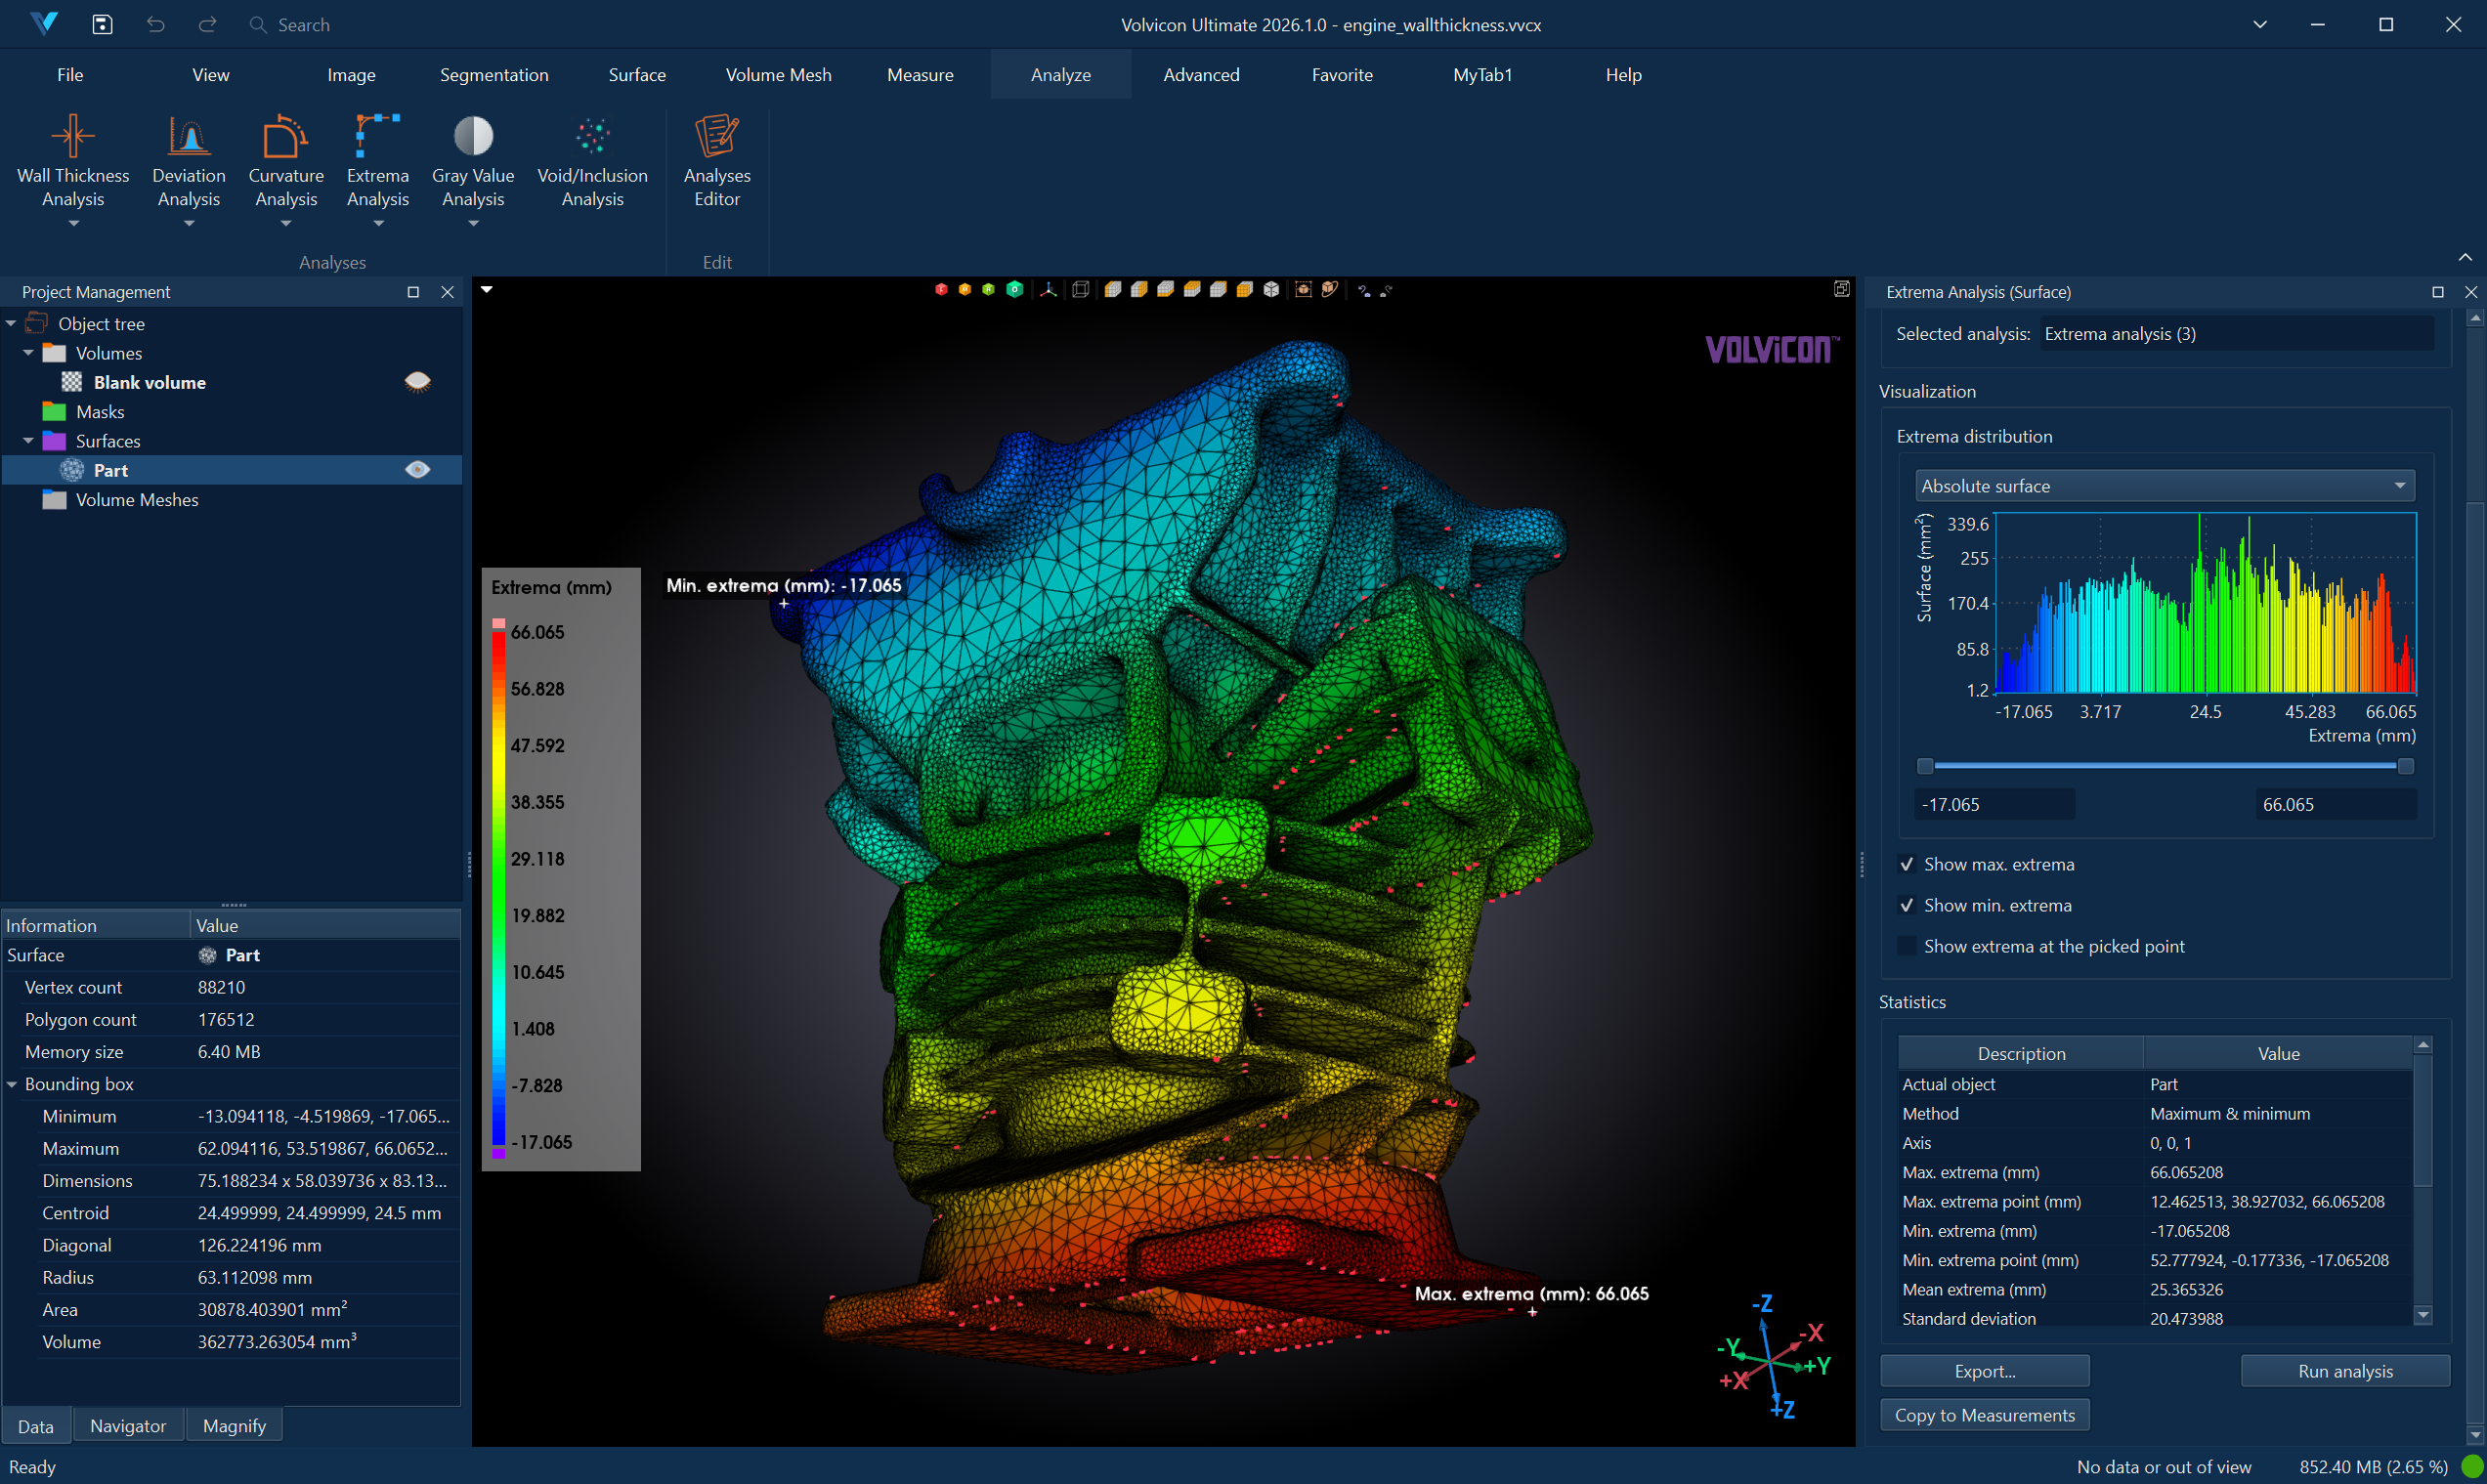
Interpreting Results
Visualization
The analyzed object displays a color gradient representing the projection distance along the specified direction:
- Cool colors (blue): Lower values (closer to minimum along the direction)
- Warm colors (red): Higher values (closer to maximum along the direction)
The color mapping essentially creates an elevation-style visualization relative to the chosen axis.
Statistics
The statistics table displays key metrics:
| Statistic | Description |
|---|---|
| Actual Object | Name of the analyzed object. |
| Method | Extrema detection method used. |
| Direction | Direction vector used for the analysis. |
| Maximum Value (mm) | Highest projection value (global maximum). |
| Maximum Point | Coordinates of the global maximum location. |
| Minimum Value (mm) | Lowest projection value (global minimum). |
| Minimum Point | Coordinates of the global minimum location. |
| Mean Value (mm) | Average projection value across all points. |
| Standard Deviation | Variation in projection values. |
| Range | Current visualization range. |
| Area Below Min. Range (%) | Percentage of surface below the minimum range. |
| Area Above Max. Range (%) | Percentage of surface above the maximum range. |
| Area Within Range (%) | Percentage of surface within the selected range. |
Interactive Features
| Feature | Description |
|---|---|
| Show Maximum | Displays an annotation at the global maximum point. |
| Show Minimum | Displays an annotation at the global minimum point. |
| Pick Point | Enable interactive picking to display projection values at any clicked location. |
Typical Workflows
Height Distribution Analysis
- Load the object to analyze.
- Create a new Extrema Analysis with direction (0, 0, 1) (Z-axis).
- Select Maximum & Minimum method.
- Run the analysis.
- Review the color map to understand height distribution.
- Use Show Maximum and Show Minimum to identify extreme points.
Finding the Highest/Lowest Points
- Configure Extrema Analysis with the appropriate direction.
- Run the analysis.
- Enable Show Maximum to locate the highest point.
- Enable Show Minimum to locate the lowest point.
- Use Copy to Measurements to record these locations.
Dimensional Extent Measurement
- Analyze the object using the direction of interest.
- Note the Maximum and Minimum values in the statistics.
- The difference (Maximum - Minimum) gives the object's extent along that direction.
Feature Detection
- Analyze a surface using Maximum method to find peaks.
- Analyze the same surface using Minimum method to find valleys.
- Compare results to understand the topographic features of the object.
Oblique Reference Analysis
- Determine the custom direction vector for your reference axis.
- Enter the direction components in the Axis dialog.
- Run the analysis to project the surface onto the custom axis.
- Use results for measurements relative to tilted or angled references.
Exporting Results
CSV Export
Click Export and select CSV to save:
- Statistical summary data
- Projection value distribution histogram data
- Extrema locations and values
PDF Report
Click Export and select PDF Report to generate a formatted document containing:
- Analysis configuration and parameters
- 3D visualization screenshots
- Histogram and statistics
- Extrema location annotations
See PDF Report for detailed report customization options.
Best Practices
-
Choose the direction carefully: The direction vector determines what "maximum" and "minimum" mean. Align it with the measurement intent.
-
Normalize custom vectors: While not required, using normalized direction vectors (length = 1) makes results easier to interpret.
-
Consider object orientation: Ensure the object is oriented correctly relative to the analysis direction. Use Transform tools if needed.
-
Use appropriate surface quality: For mask analyses, higher quality provides more accurate extrema detection.
-
Combine with other analyses: Extrema analysis complements Curvature Analysis for understanding surface geometry.
Troubleshooting
| Issue | Possible Cause | Solution |
|---|---|---|
| Unexpected maximum/minimum locations | Object not aligned with intended direction | Rotate the object or adjust the direction vector |
| Very similar max and min values | Object is nearly flat along the direction | Choose a different analysis direction |
| Noisy results | Rough mesh surface | Apply smoothing before analysis |
| Direction vector not accepted | Invalid or zero-length vector | Ensure at least one component is non-zero |
Related Resources
- Analyze Tab Overview – Overview of all analysis tools
- Curvature Analysis – Analyze surface curvature properties
- Surface Elevation – Related elevation visualization tool
- Transform – Reorient objects for analysis
- PDF Report – Generate analysis reports
- Analysis Operations API – Scripting support for analysis automation