Measurements
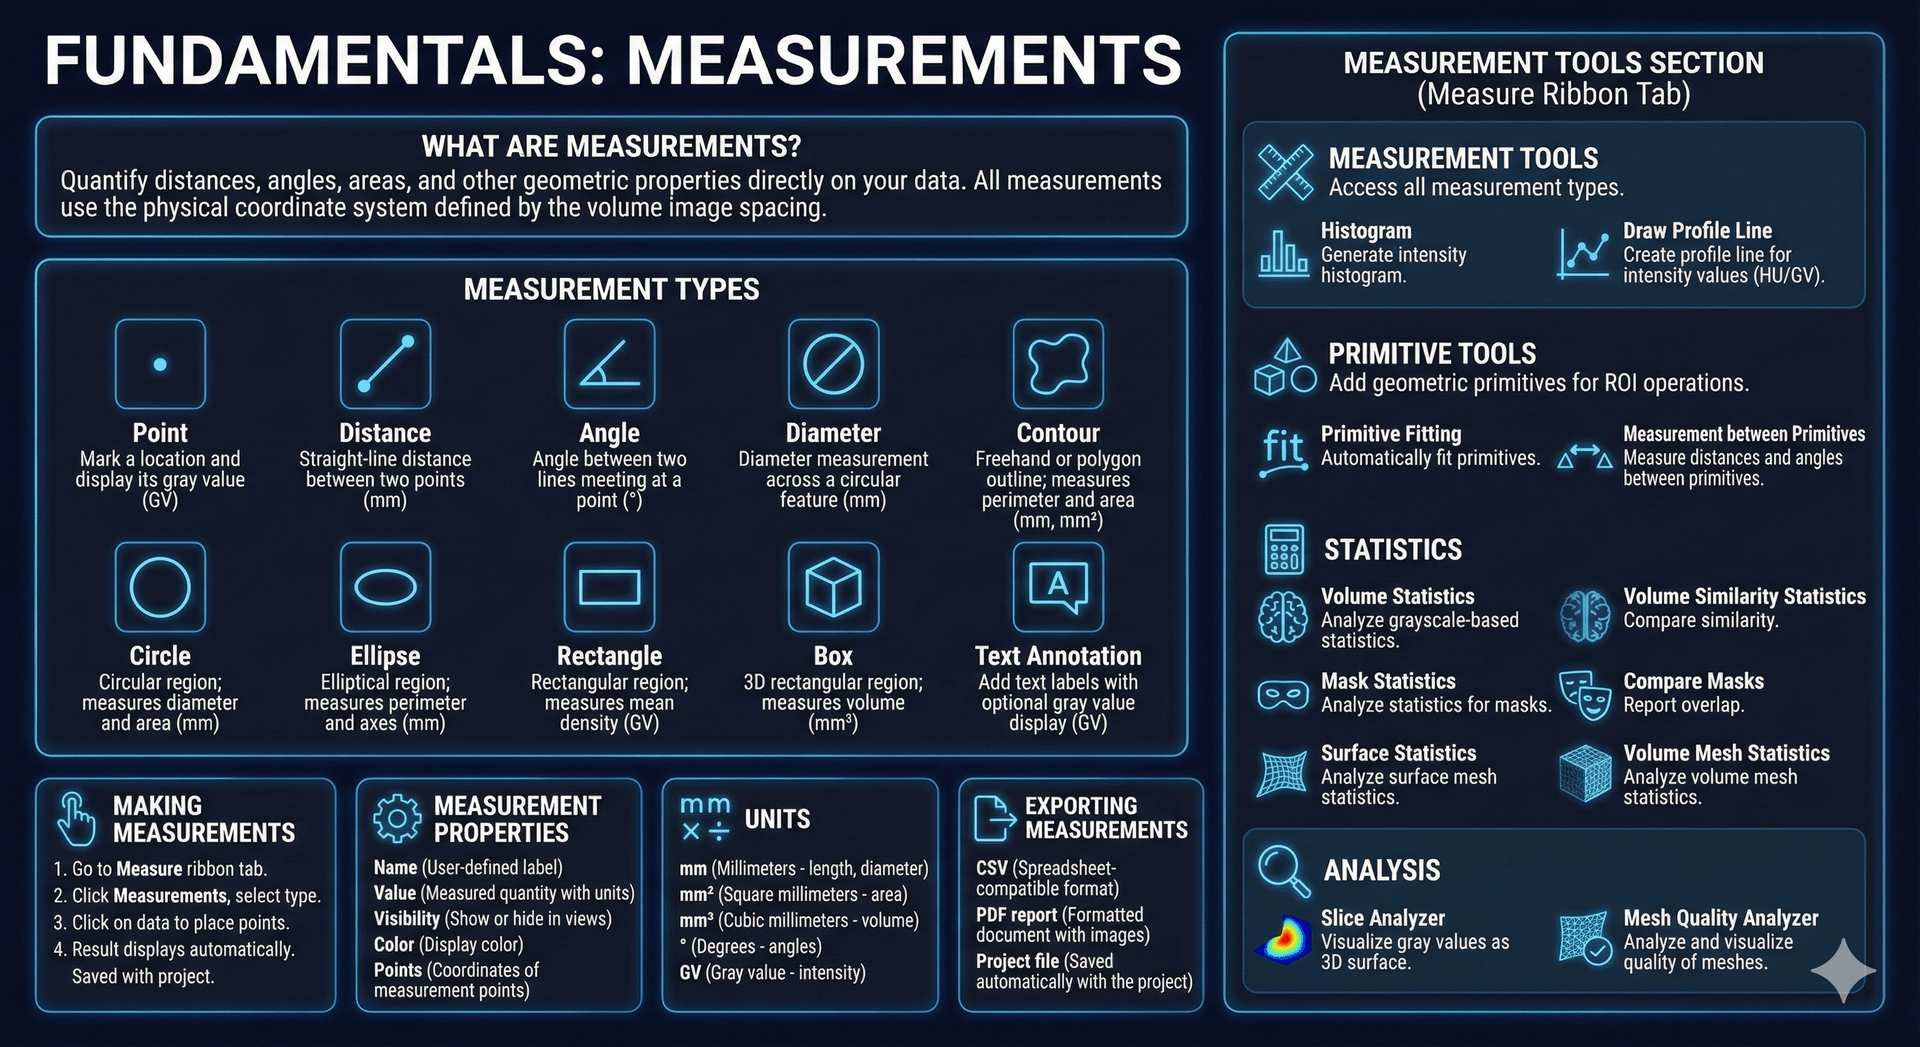
Measurements in Volvicon allow you to quantify distances, angles, areas, and other geometric properties directly on your data. All measurements use the physical coordinate system defined by the volume image spacing.
Measurement Types
Volvicon provides the following measurement tools, accessible from the Measure ribbon tab:
| Measurement | Description | Unit |
|---|---|---|
| Point | Mark a location and display its gray value | GV |
| Distance | Straight-line distance between two points | mm |
| Angle | Angle between two lines meeting at a point | ° |
| Diameter | Diameter measurement across a circular feature | mm |
| Contour | Freehand or polygon outline; measures perimeter and area | mm, mm² |
| Circle | Circular region; measures diameter and area | mm |
| Ellipse | Elliptical region; measures perimeter and axes | mm |
| Rectangle | Rectangular region; measures mean density | GV |
| Box | 3D rectangular region; measures volume | mm³ |
| Text Annotation | Add text labels with optional gray value display | GV |
Measurement Tools Section
The Measure ribbon tab contains these tool groups:
Measurement Tools
| Tool | Description |
|---|---|
| Measurements | Access all measurement types (Point, Distance, Angle, Diameter, Contour, Circle, Ellipse, Rectangle, Box, Caption) |
| Histogram | Generate intensity histogram for the active volume image |
| Draw Profile Line | Create a profile line to visualize intensity values (HU or GV) along a path |
Primitive Tools
| Tool | Description |
|---|---|
| Primitives | Add geometric primitives for ROI operations |
| Primitive Fitting | Automatically fit primitives to geometry |
| Measurement between Primitives | Measure distances and angles between two primitive objects |
Statistics
| Tool | Description |
|---|---|
| Volume Statistics | Analyze grayscale-based statistics for volume datasets |
| Volume Similarity Statistics | Compare similarity between two volume datasets |
| Mask Statistics | Analyze statistics for masks (whole, per-region, per-label, 3D preview) |
| Compare Masks | Report overlap statistics between two masks |
| Surface Statistics | Analyze statistics for surface meshes (whole or per-region) |
| Volume Mesh Statistics | Analyze statistics for volume meshes |
Analysis
| Tool | Description |
|---|---|
| Slice Analyzer | Visualize gray values of a slice as a 3D surface with false-color enhancement |
| Mesh Quality Analyzer | Analyze and visualize quality of surface meshes or volume meshes |
Making Measurements
To create a measurement:
- Go to the Measure ribbon tab
- Click Measurements and select a measurement type
- Click on the data to place measurement points
- The result displays automatically with the appropriate unit
- Measurements are saved with the project
Measurement Properties
| Property | Description |
|---|---|
| Name | User-defined label |
| Value | Measured quantity with units |
| Visibility | Show or hide in views |
| Color | Display color |
| Points | Coordinates of measurement points |
Units
Measurements use the units defined by the volume image:
| Unit | Description |
|---|---|
| mm | Millimeters (length, diameter) |
| mm² | Square millimeters (area) |
| mm³ | Cubic millimeters (volume) |
| ° | Degrees (angles) |
| GV | Gray value (intensity) |
Exporting Measurements
Measurements can be exported to:
- CSV – Spreadsheet-compatible format
- PDF report – Formatted document with images
- Project file – Saved automatically with the project
Related Topics
- Primitives – ROI tools for region-based operations
- Volume Grayscale Image – Understanding image coordinates